ALLAt a glance
 Sequence diagram
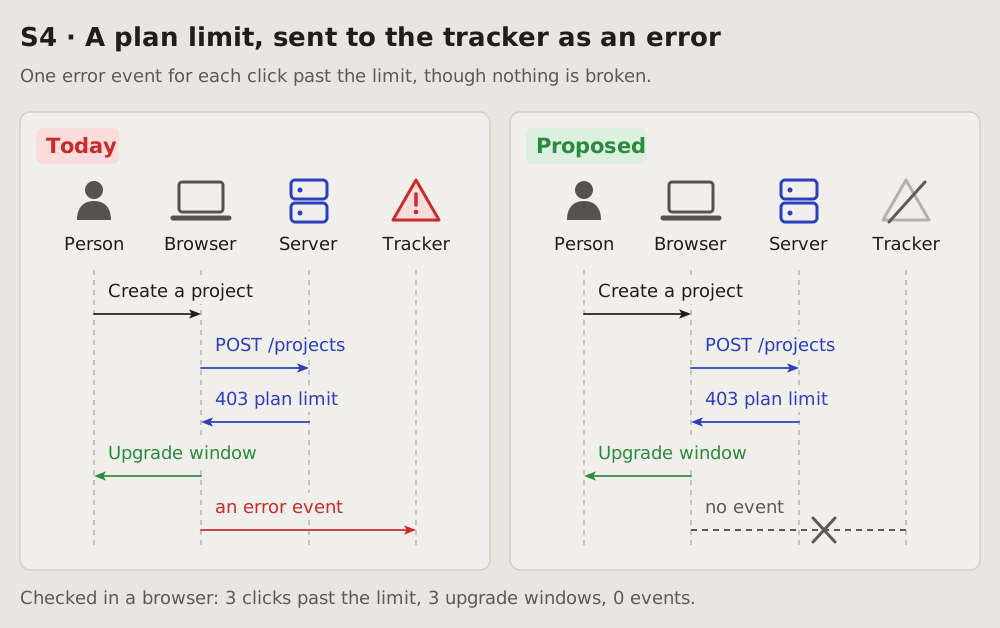
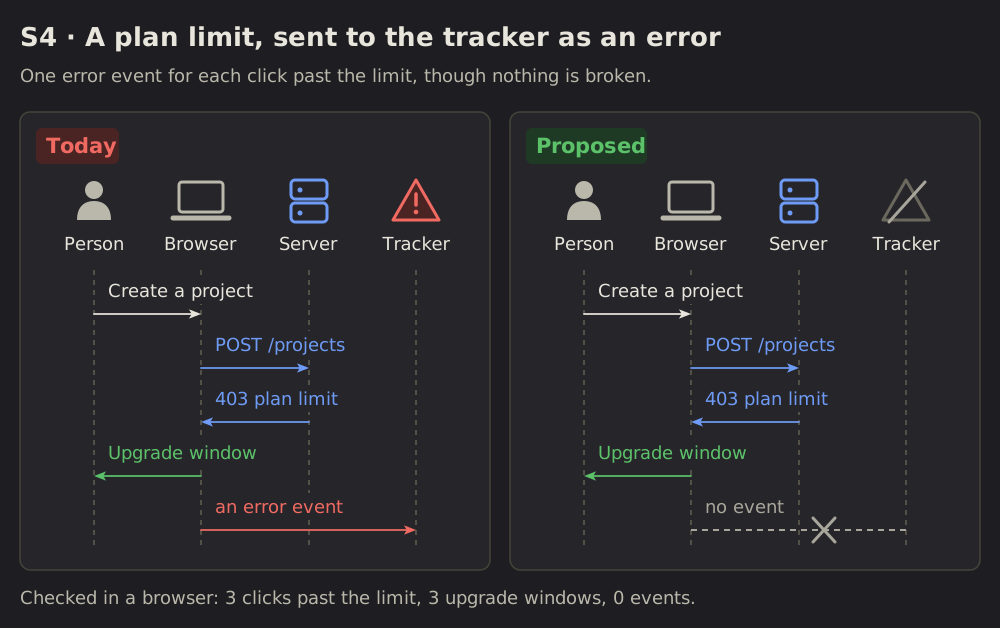
01 Sequence diagram: who talks to whom
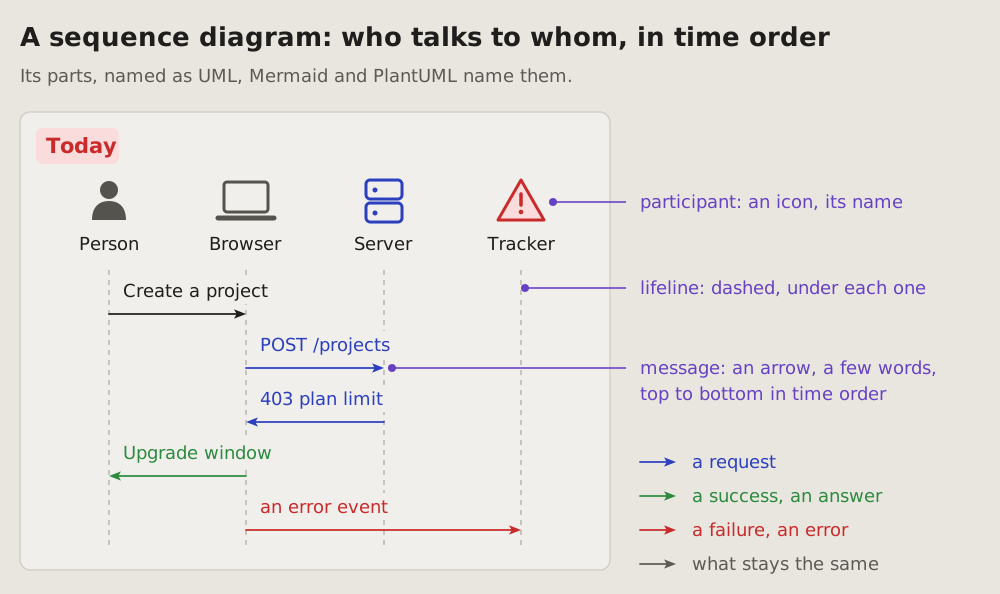
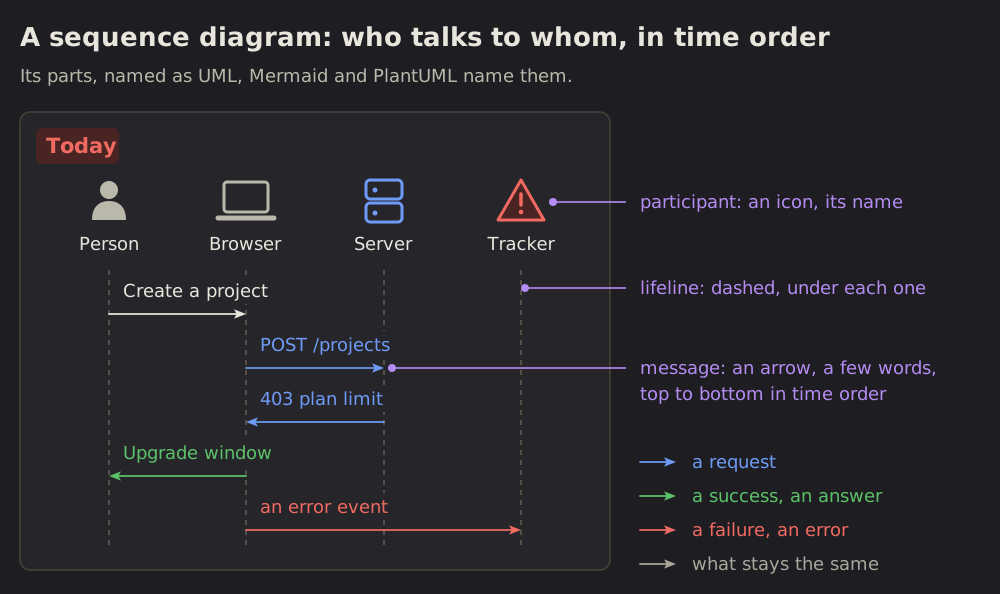
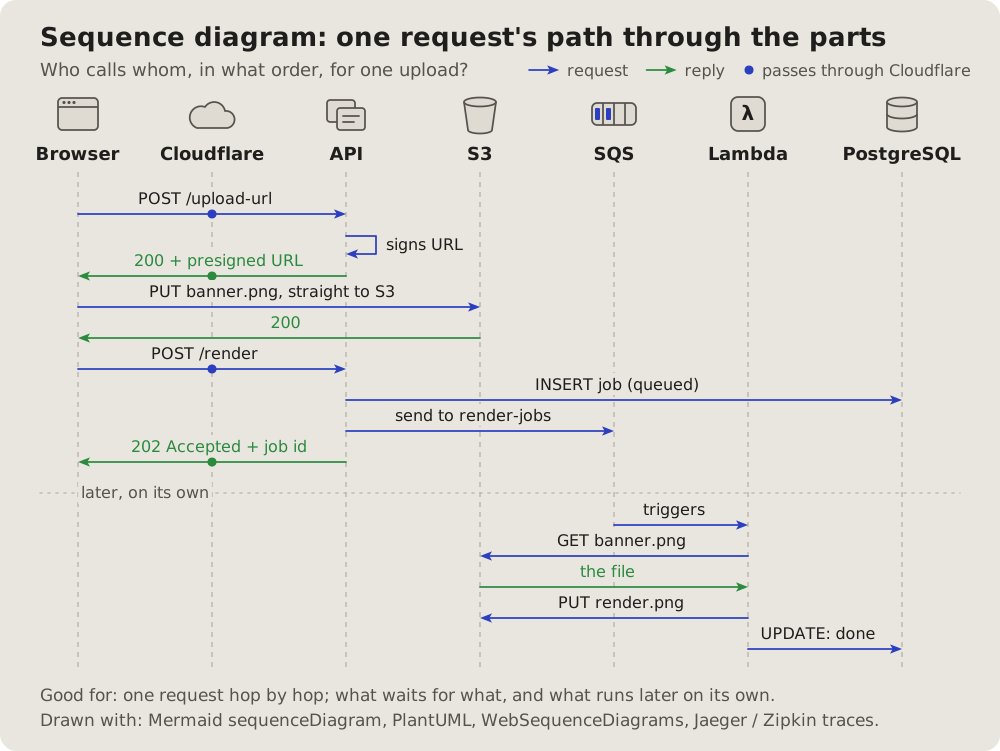
The course of events: the parts of a system as columns, what they send each other as arrows, top to bottom in time order.
 One case
02 One case: today beside fixed
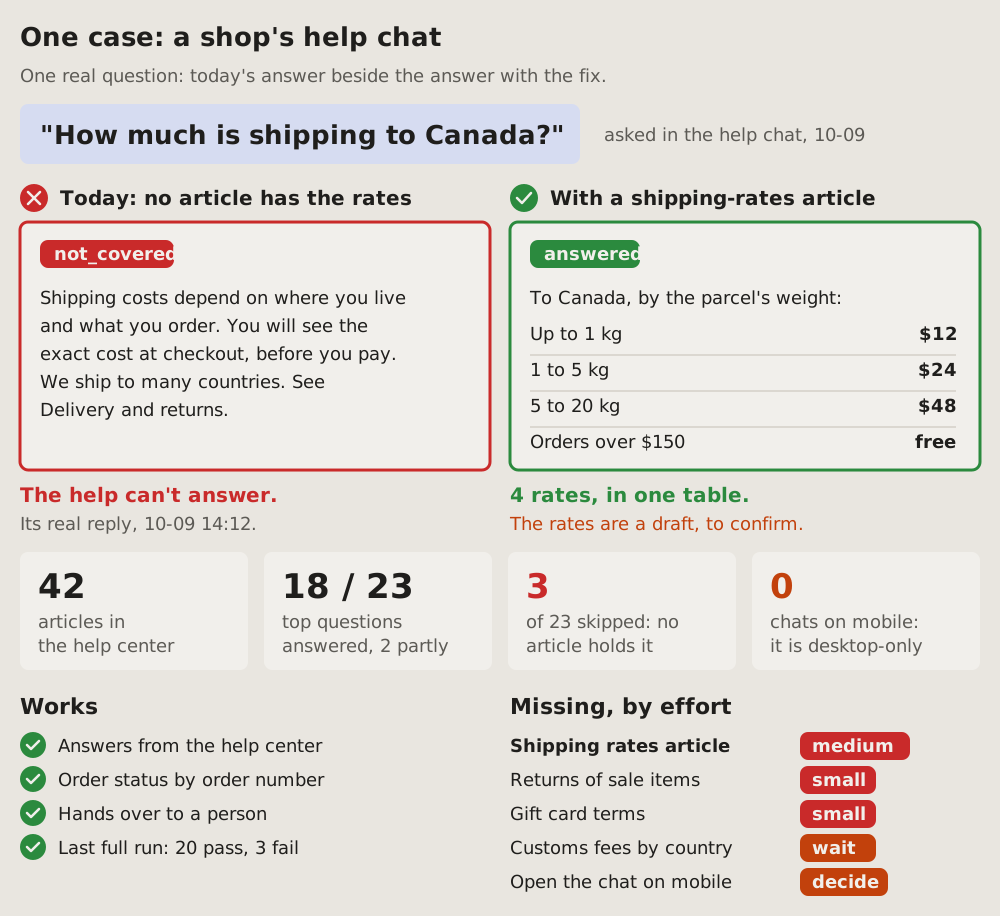
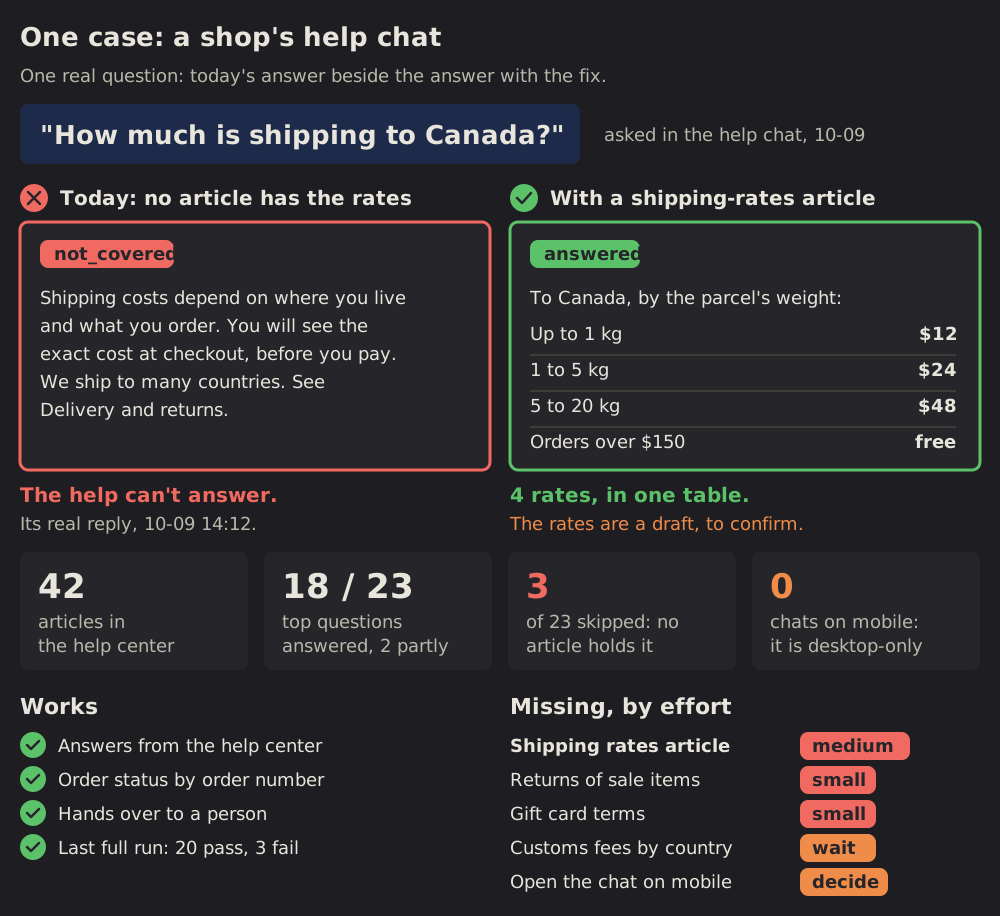
One real request, its answer today beside its answer with the fix.
 Annotated screen
03 Annotated screen: where on the screen
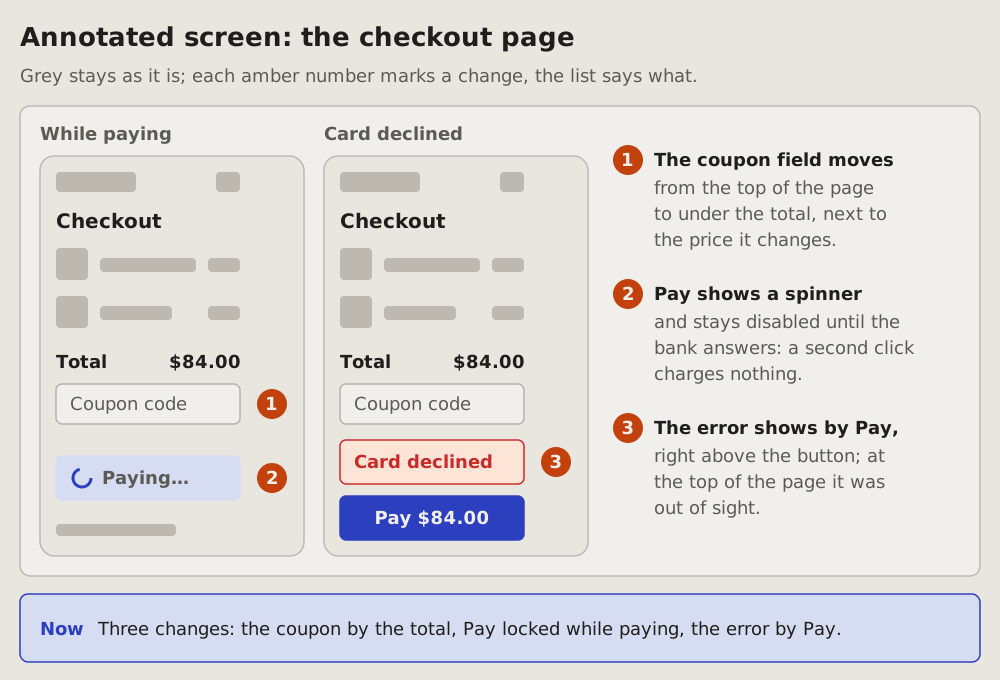
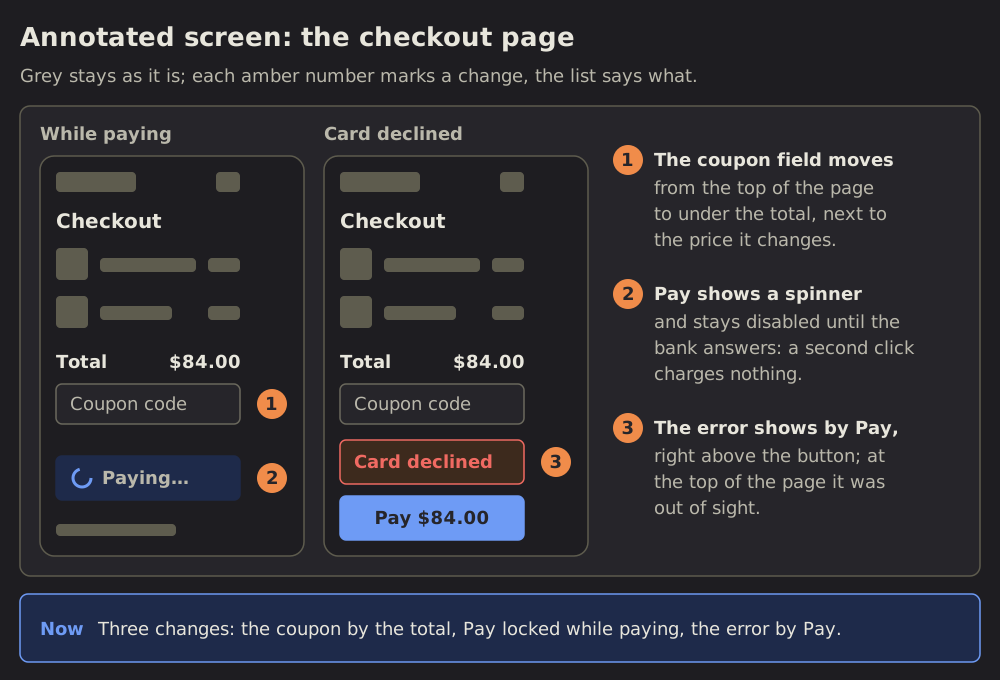
A plain sketch of a screen, grey blocks and a few real labels, with an amber number on each spot that changes.
 State diagram
04 State diagram: what moves a thing between its states
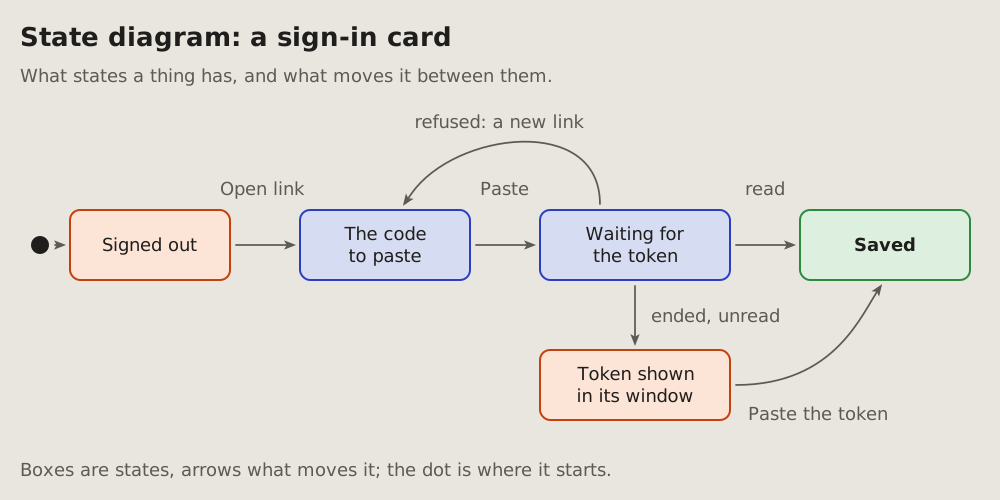
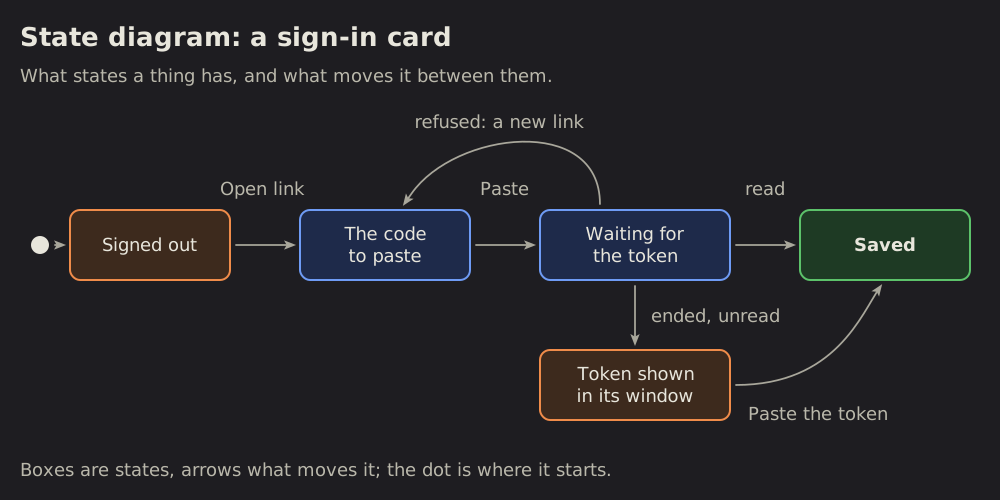
The states a thing has and what moves it from one to the next: a card's steps, a message's life, a job's run.
 Flywheel
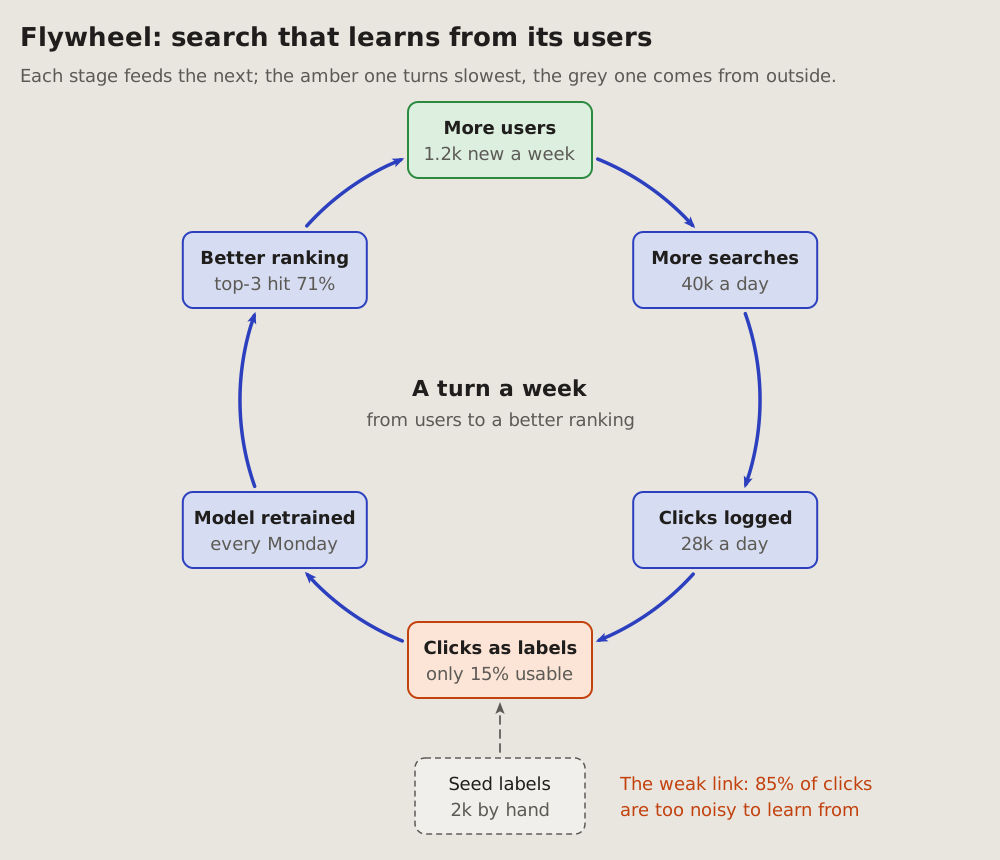
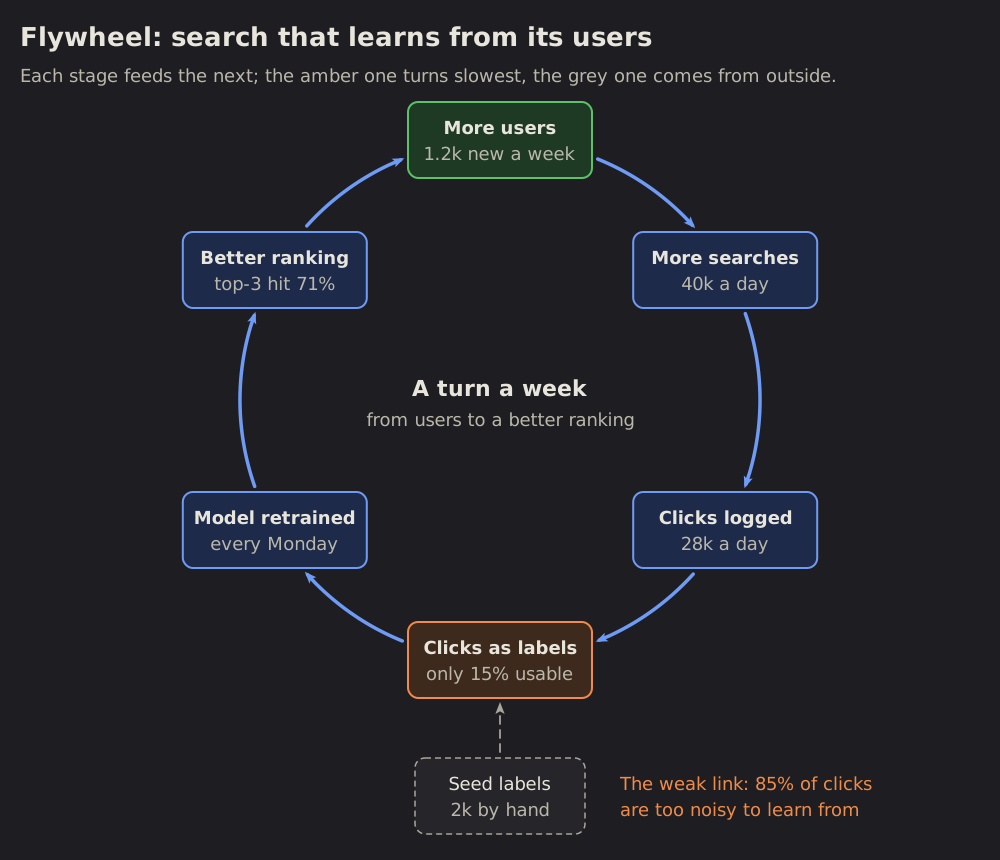
05 Flywheel: what feeds itself
A loop that grows as it turns: each stage feeds the next, and the last feeds the first, so the next turn starts bigger.
 Flowchart
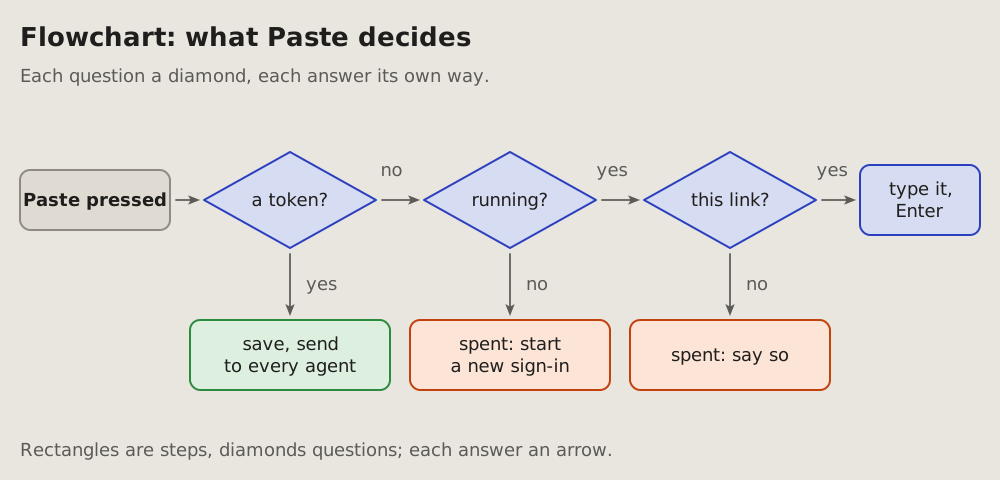
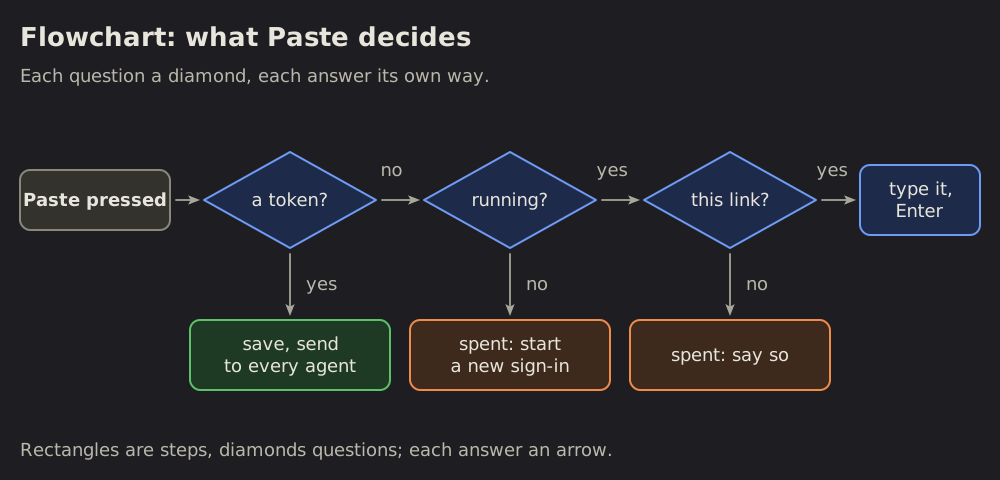
06 Flowchart: what is decided where
The decisions one action goes through, in order: each question a diamond, each answer its own arrow, each outcome a box.
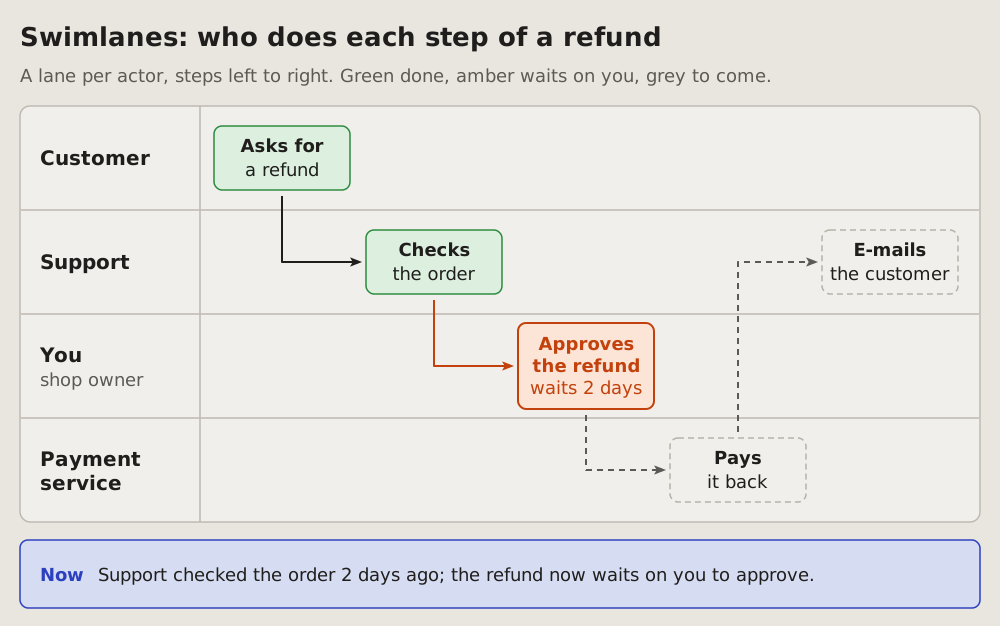
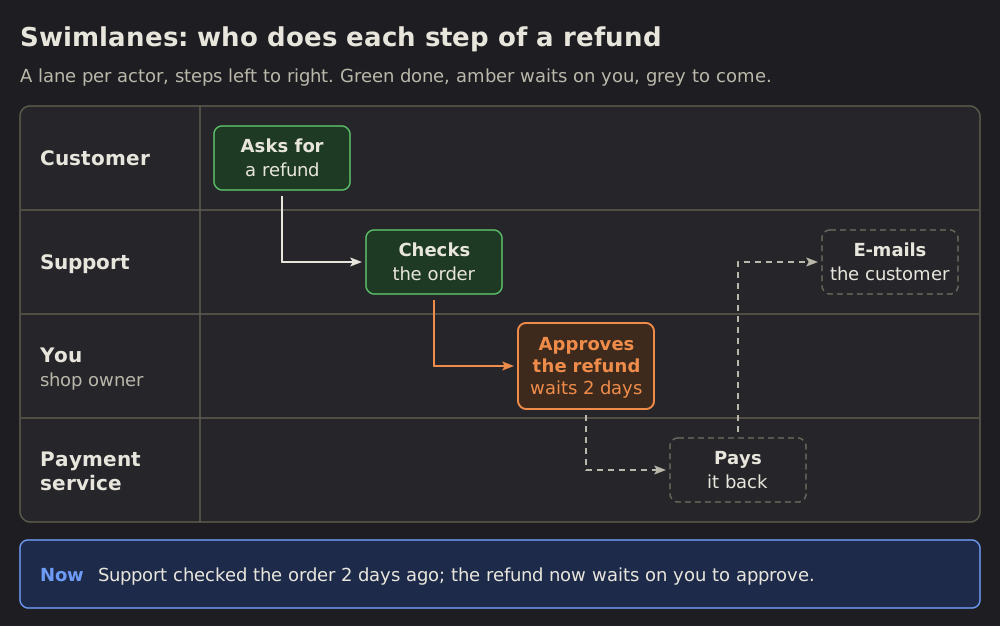 Swimlanes
07 Swimlanes: who does each step
A process as its steps in order, a lane per actor, each step a box in the lane of who does it.
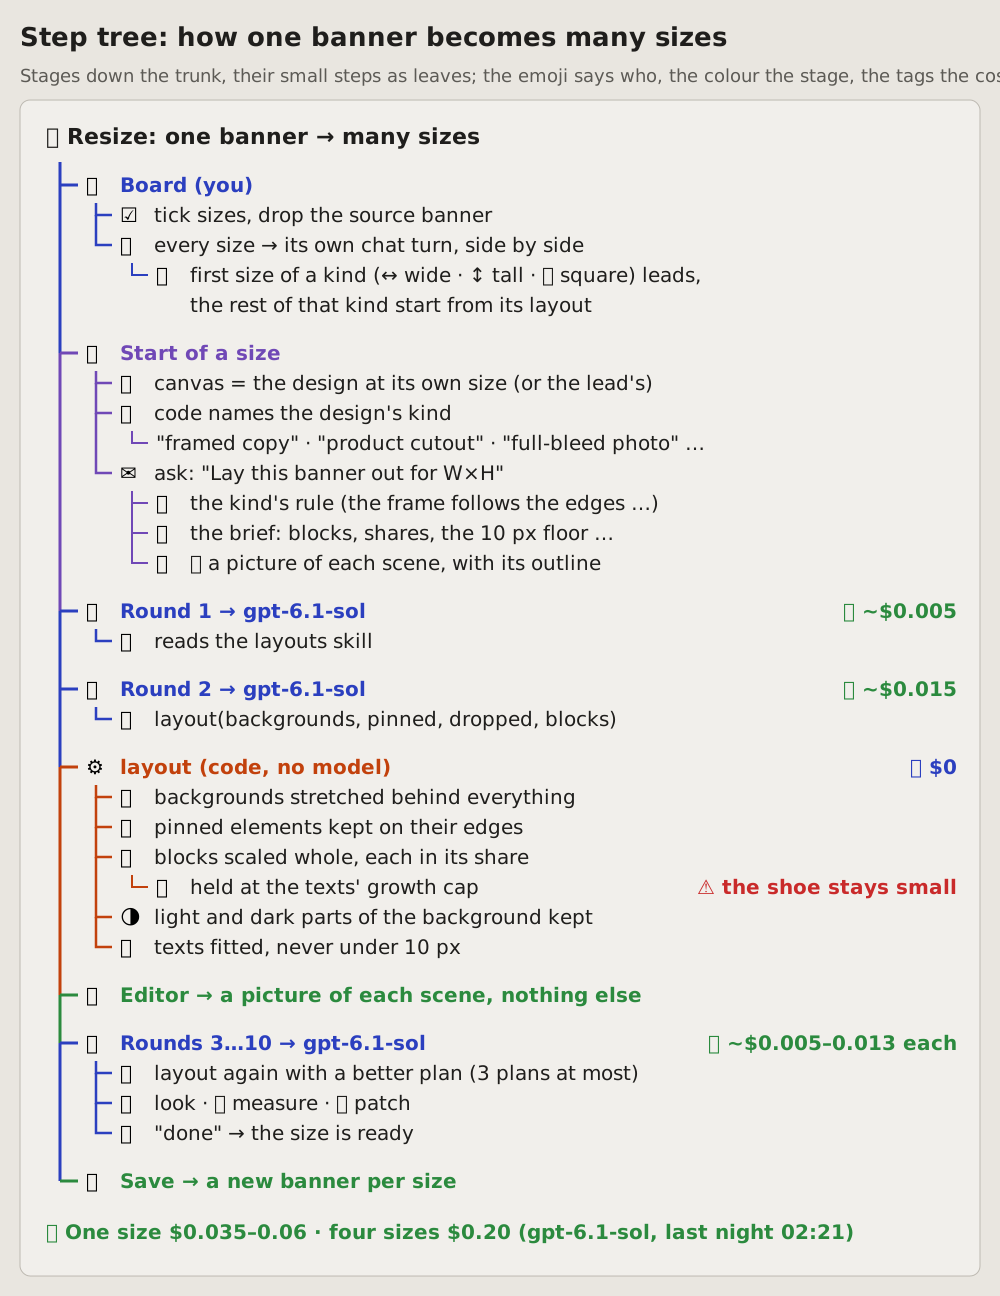
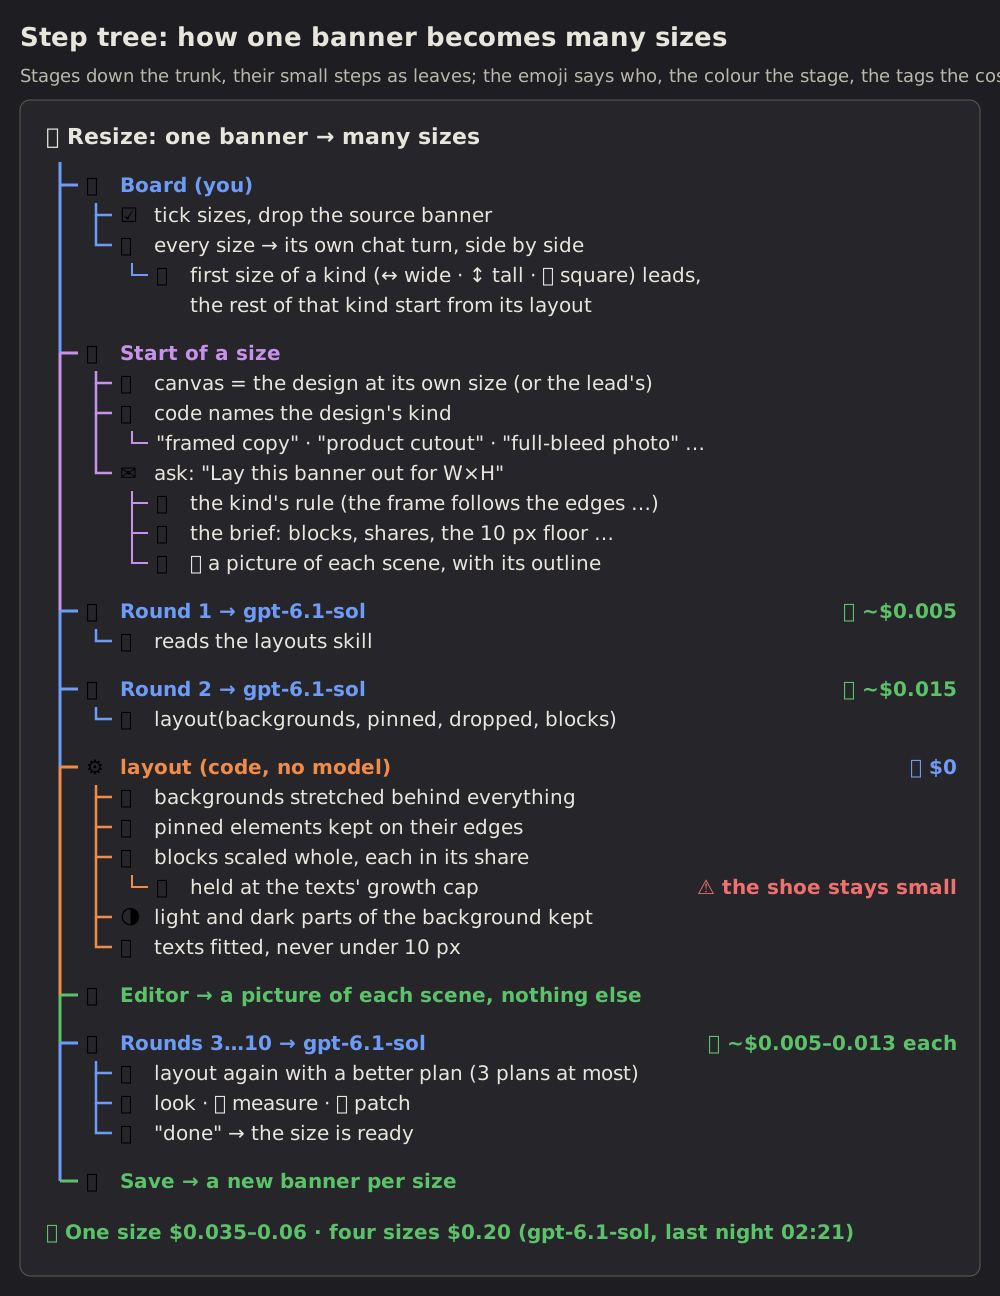 Step tree
08 Step tree: a process as its stages and their small steps
A process read top to bottom: one trunk down the left, a branch per stage, and under each stage its small steps as leaves.
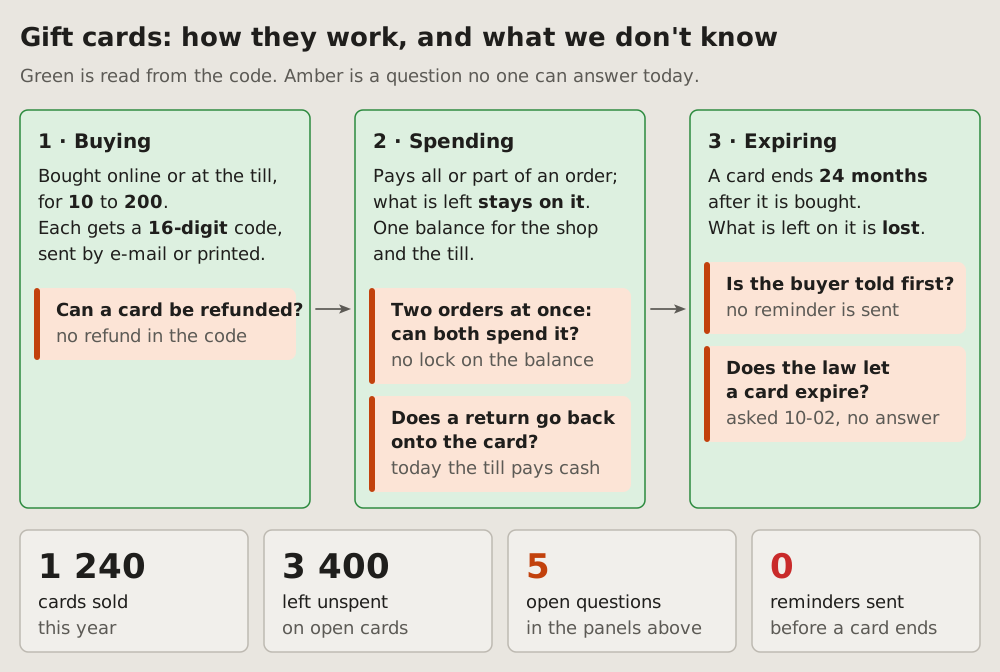
 Known and open questions
09 Known and open questions: how it works, and the gaps
How something works, stage by stage, with the facts read from the code and the questions no one can answer yet, each where it arises.
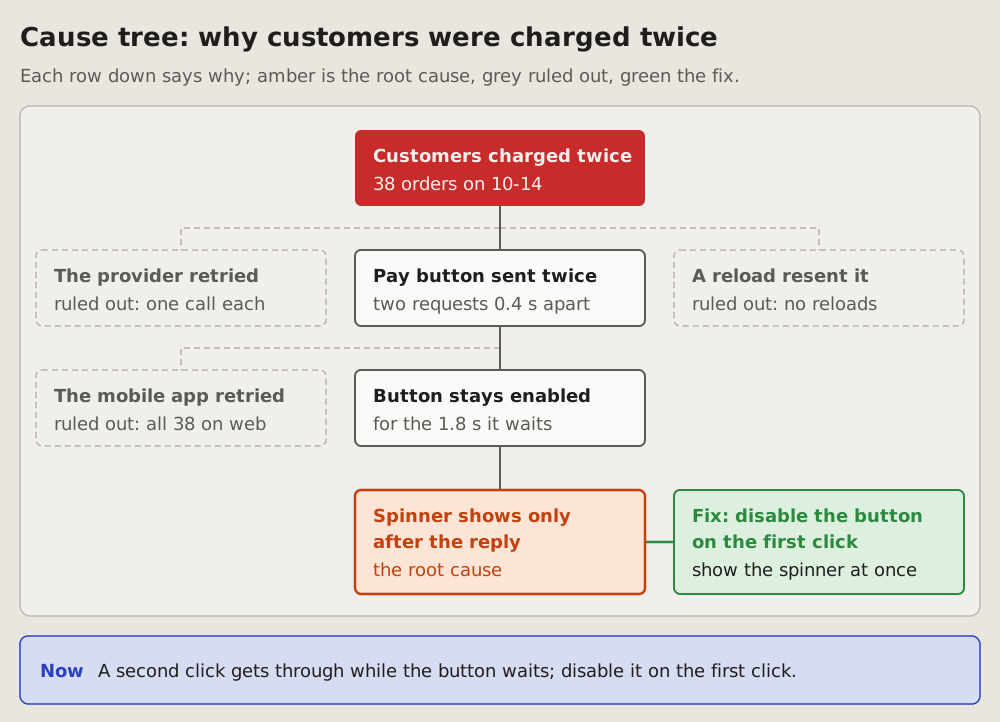
 Cause tree
10 Cause tree: why it happened
The failure on top, its causes below it as a tree: each row down says why the row above happened.
 Timeline
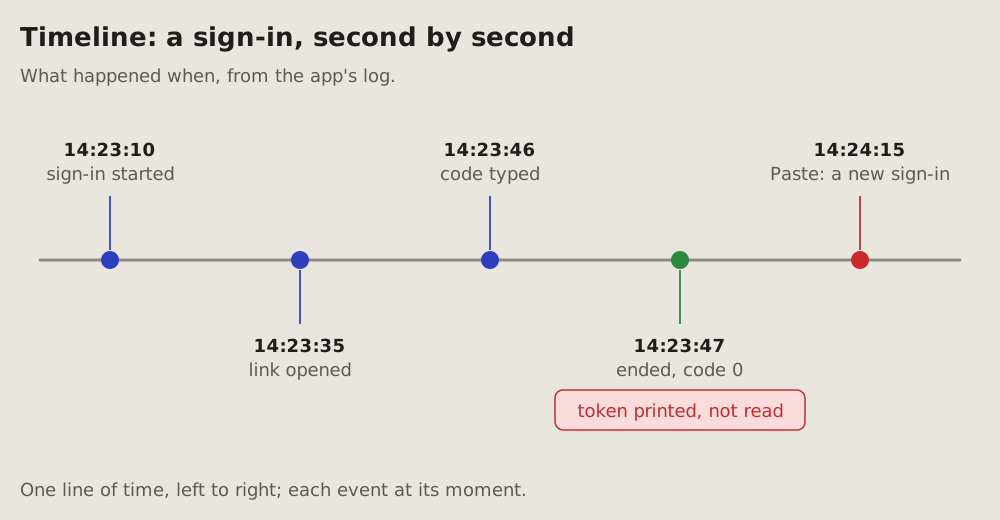
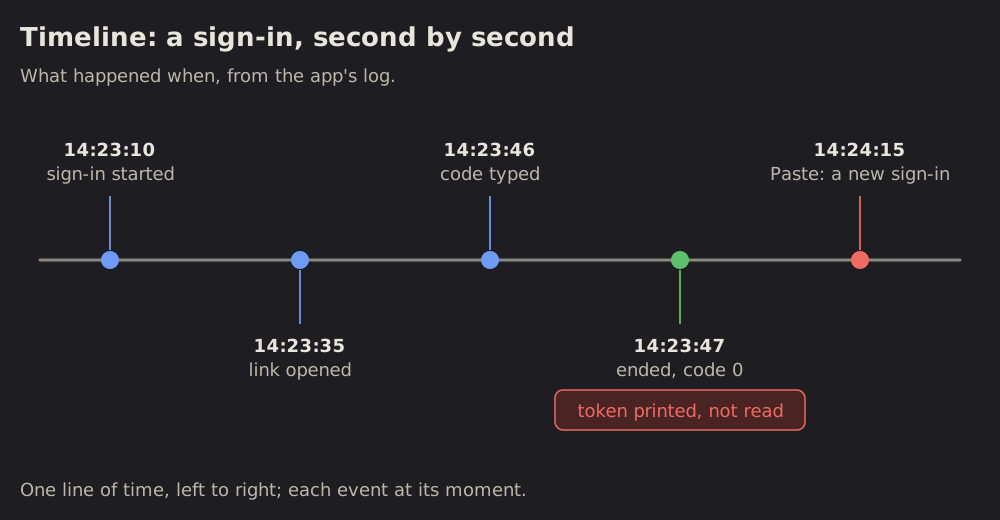
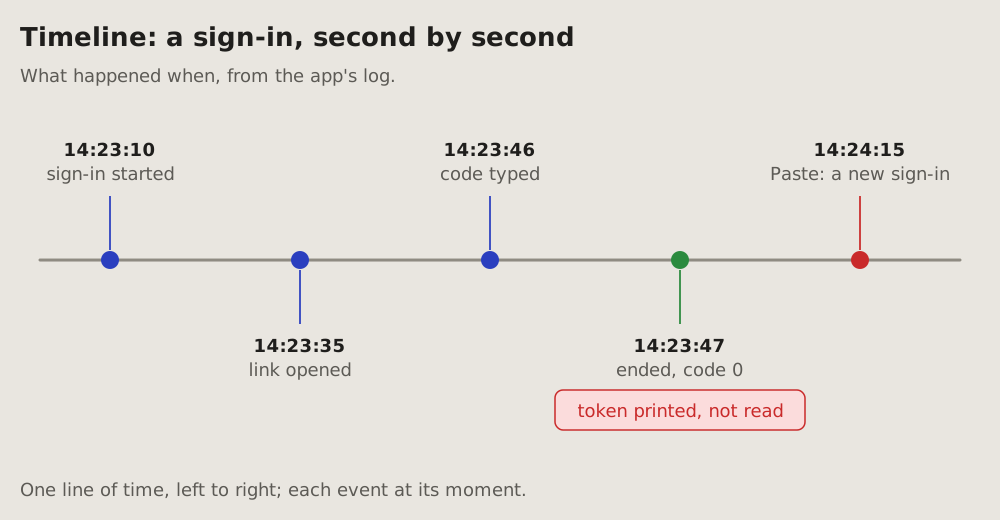
11 Timeline: what happened when
Events at their moments, from a log: one line of time, left to right, each event a dot with its time and a few words.
 Chronology
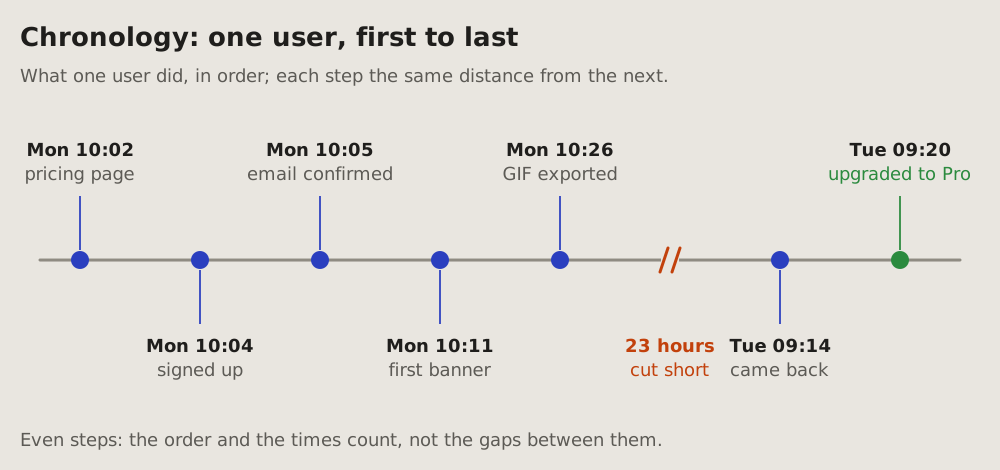
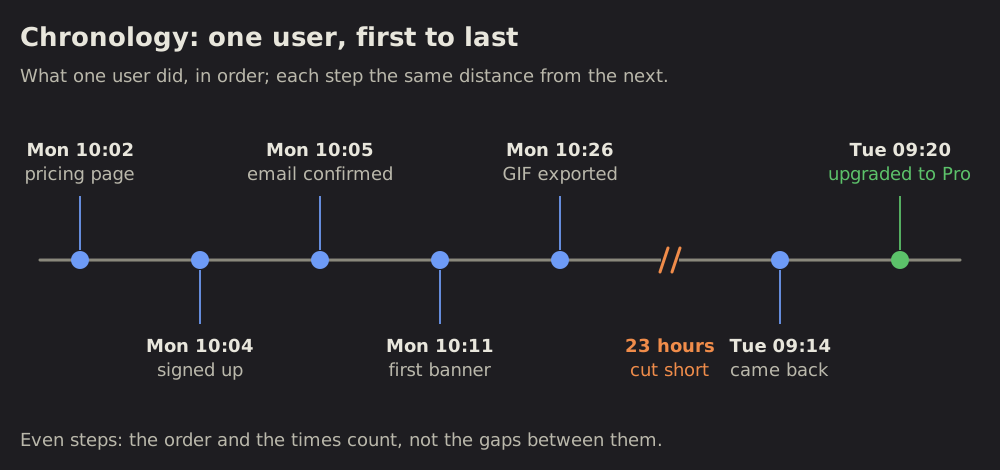
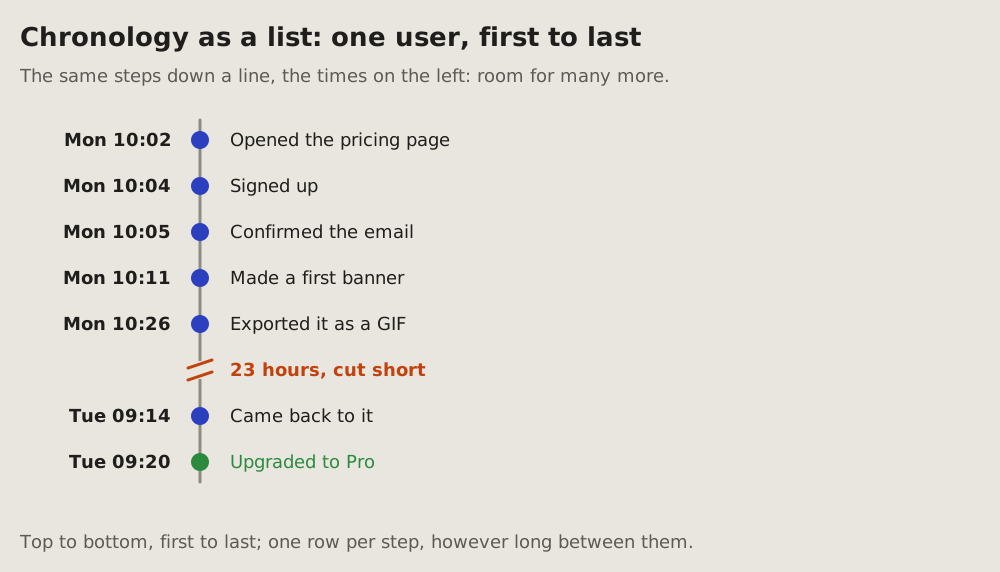
12 Chronology: what one user did, in order
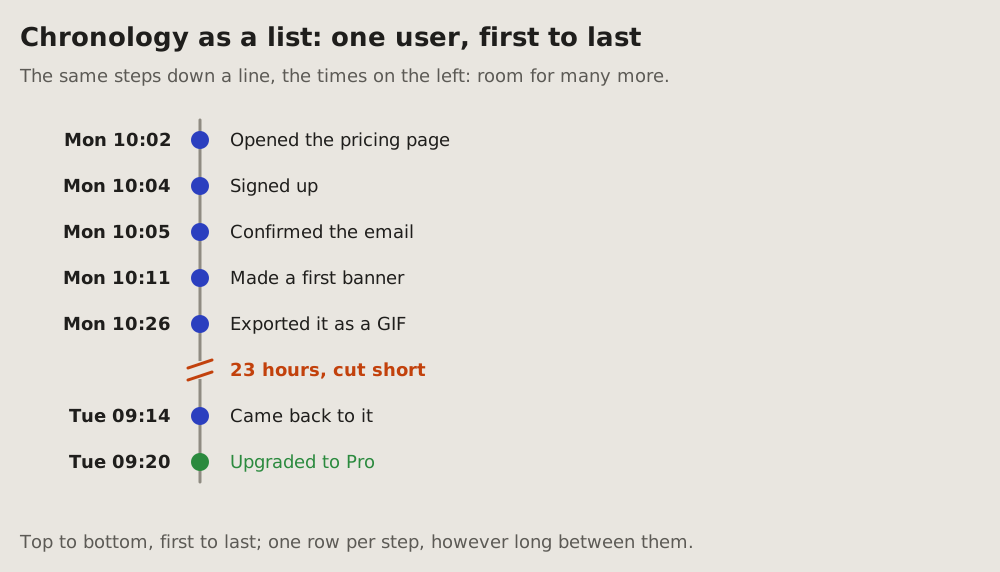
Steps in the order they happened, each with its time, at even distances: the order and the times count, not the gaps between them.
 Event plot
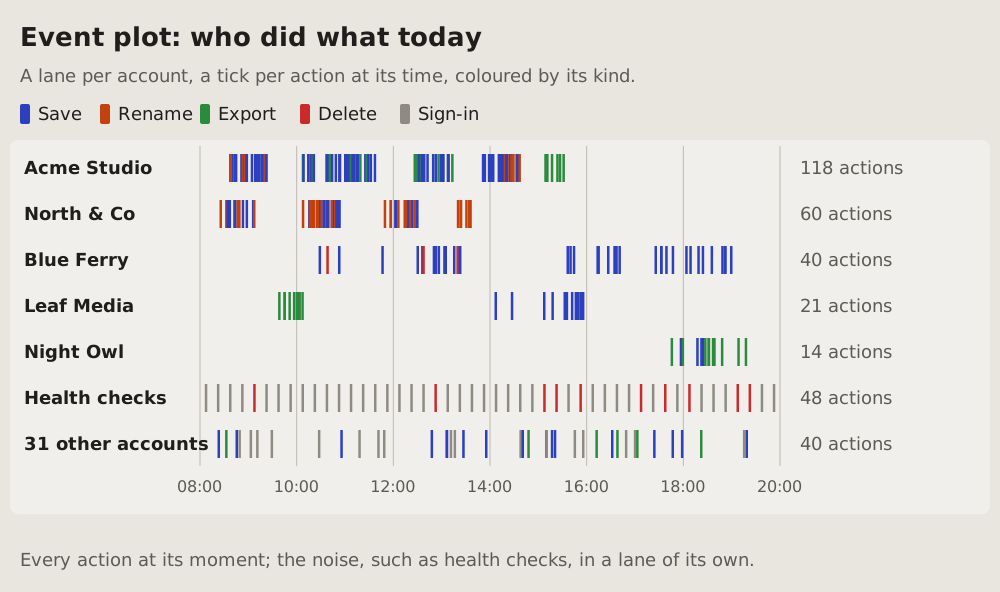
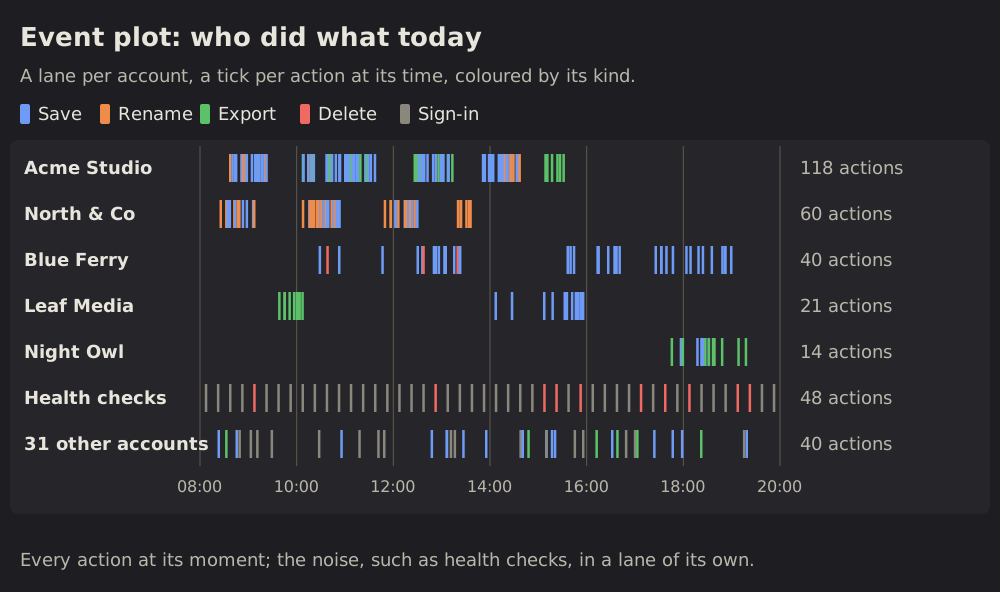
13 Event plot: who did what, when
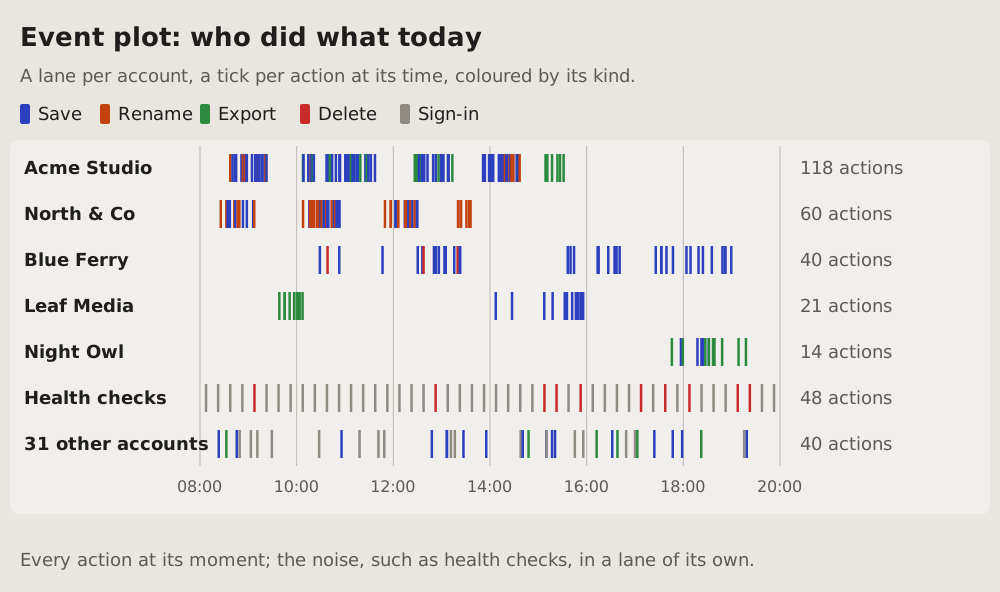
Every event of many actors at its moment: a lane per actor, a tick per event at its time, coloured by its kind.
 Milestone track
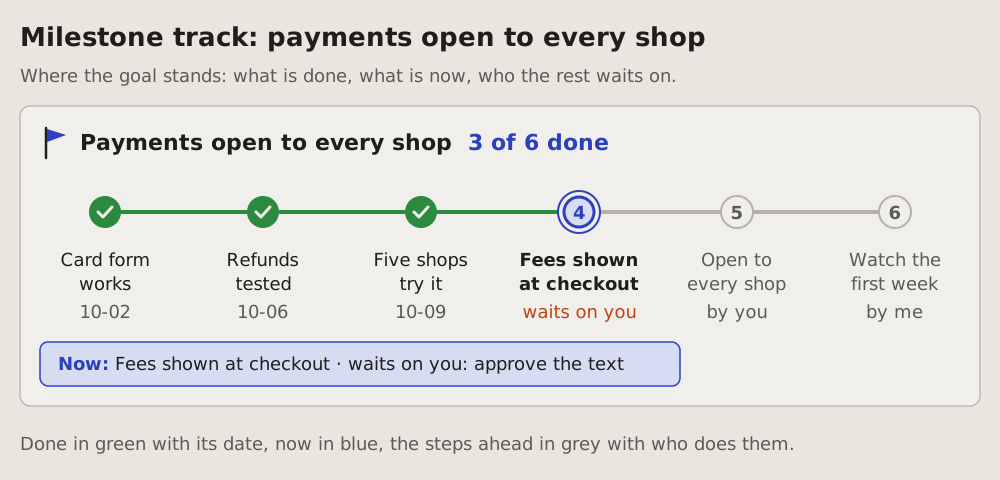
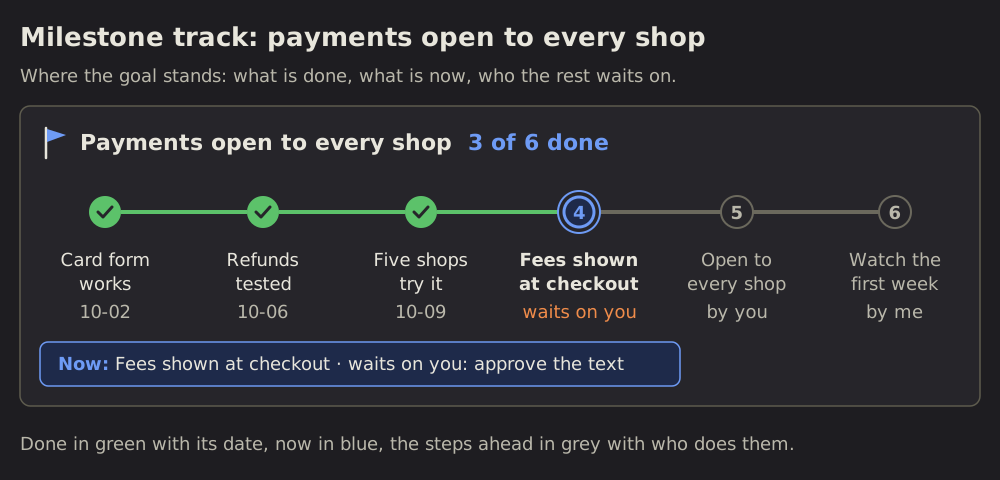
14 Milestone track: where a goal stands
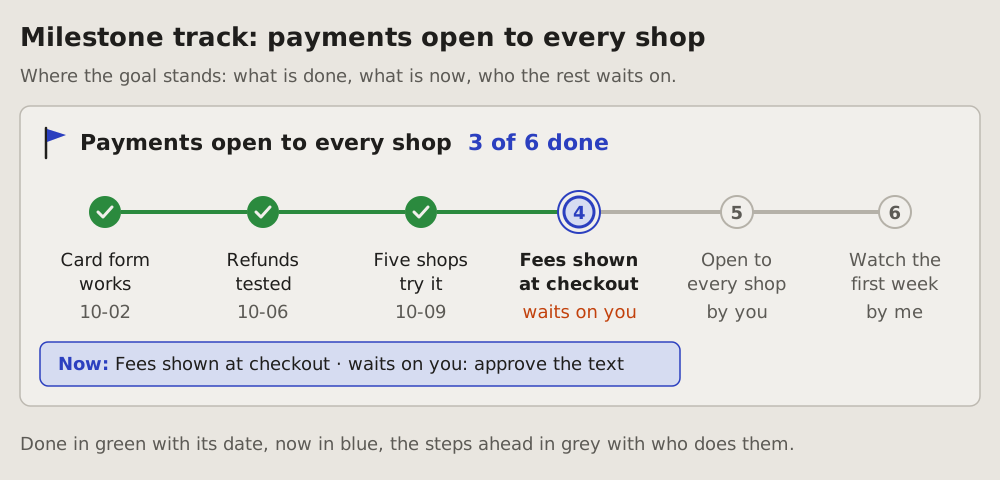
One goal and its steps on a line, left to right: the steps done, the step now, the steps ahead, and who each one waits on.
 Plan graph
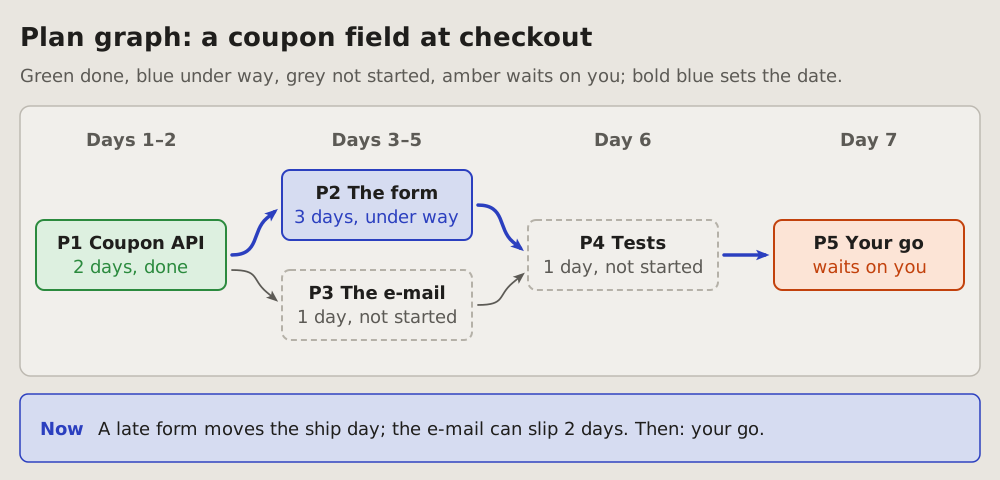
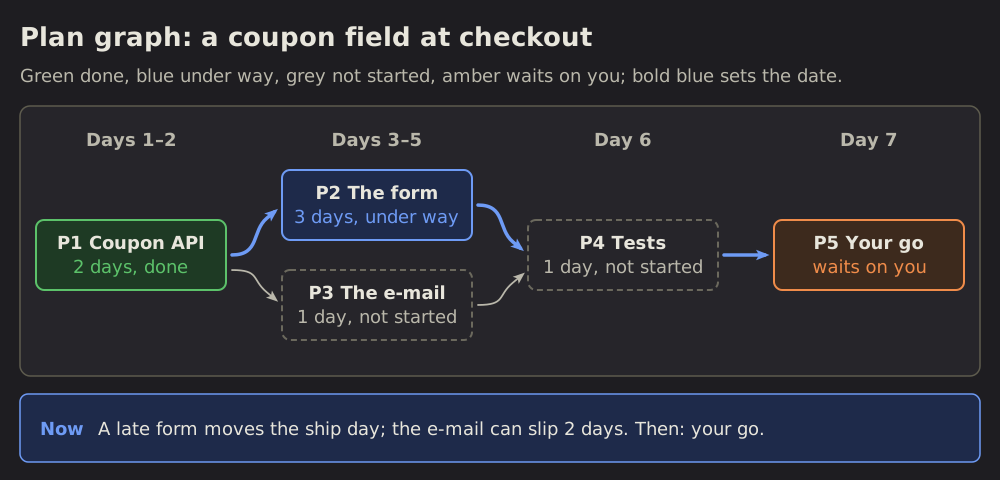
15 Plan graph: what waits on what
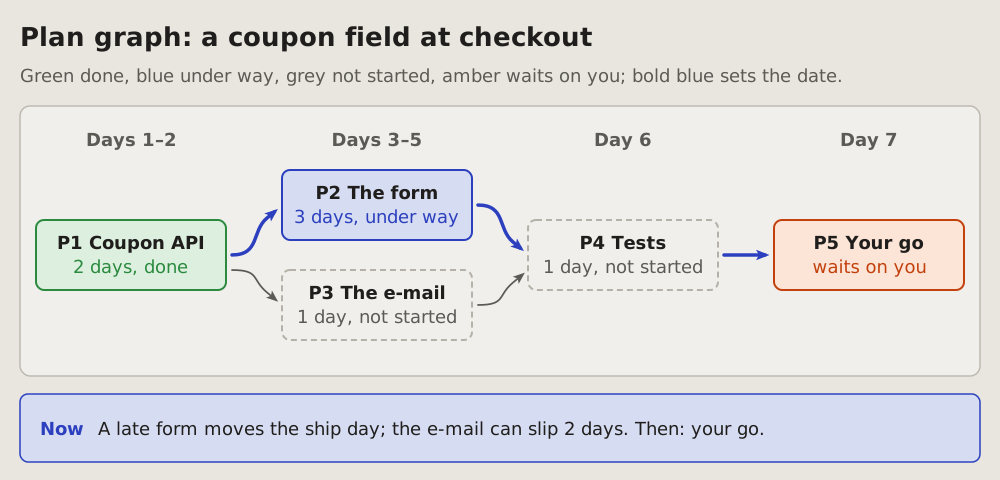
A plan's parts as boxes, an arrow from each part to the parts that wait on it.
 Roadmap
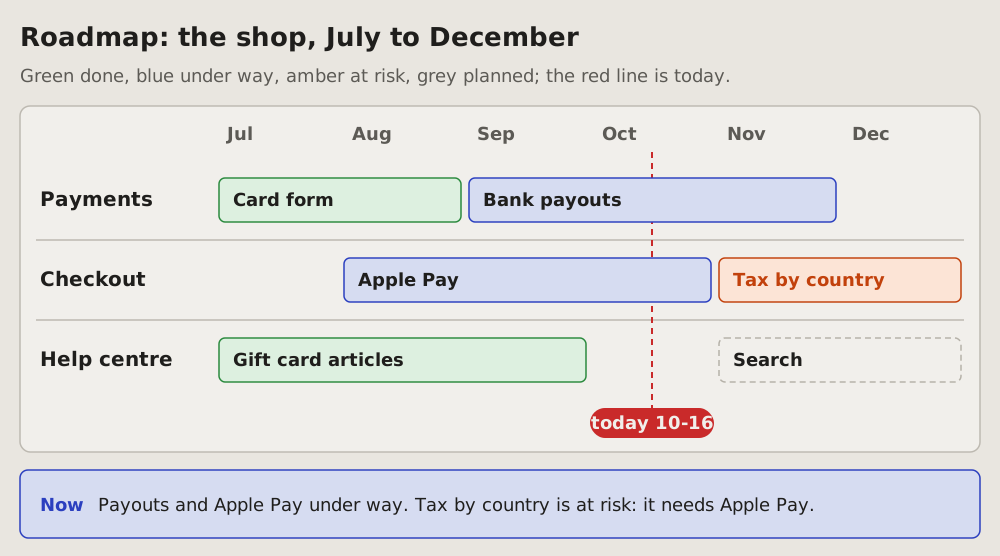
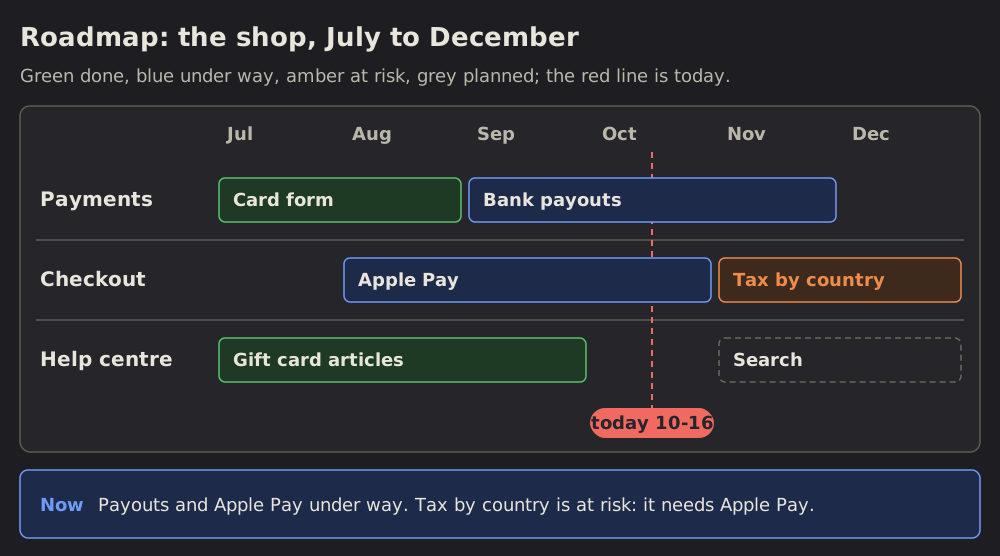
16 Roadmap: what is planned when
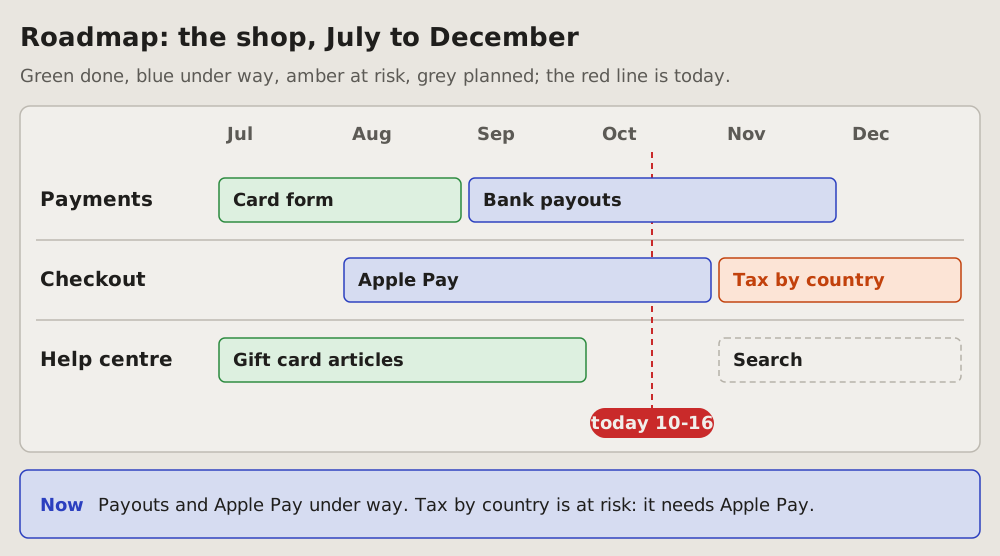
The months ahead on one line of time, a lane per area of work, each piece of work a bar from its start to its end; a red line marks today.
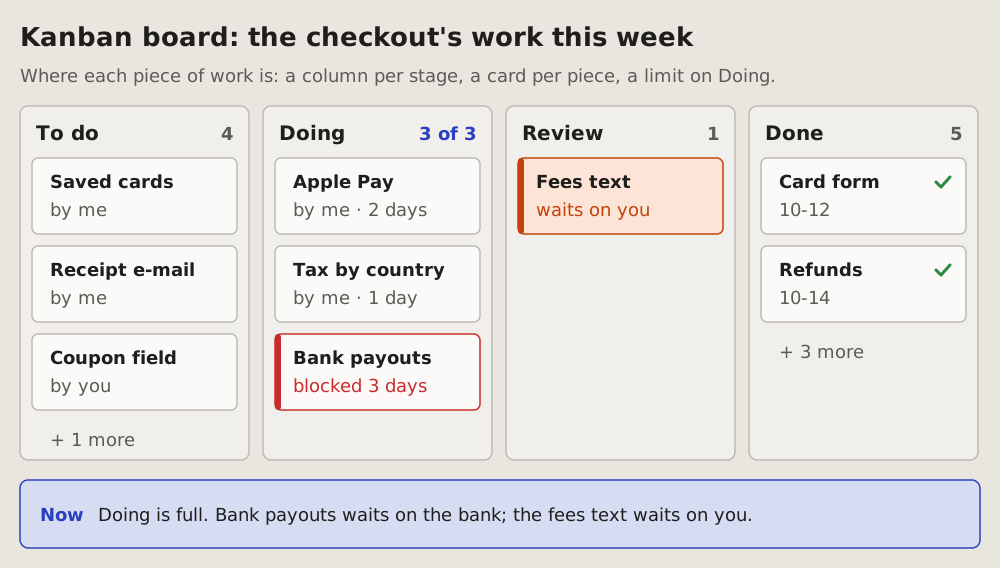
 Kanban board
17 Kanban board: where each piece of work is
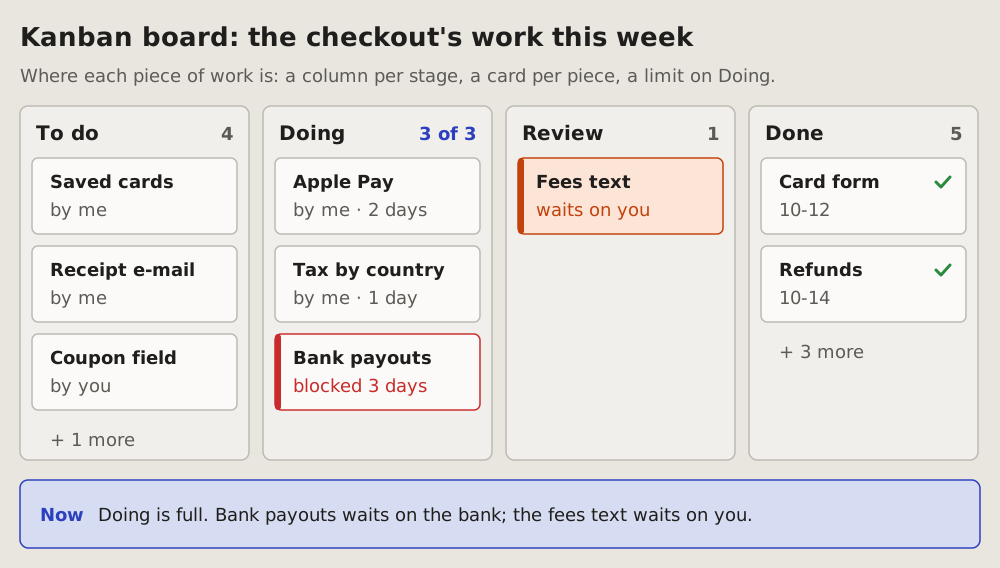
Many pieces of work at once, each in the column of its stage: to do, doing, in review, done.
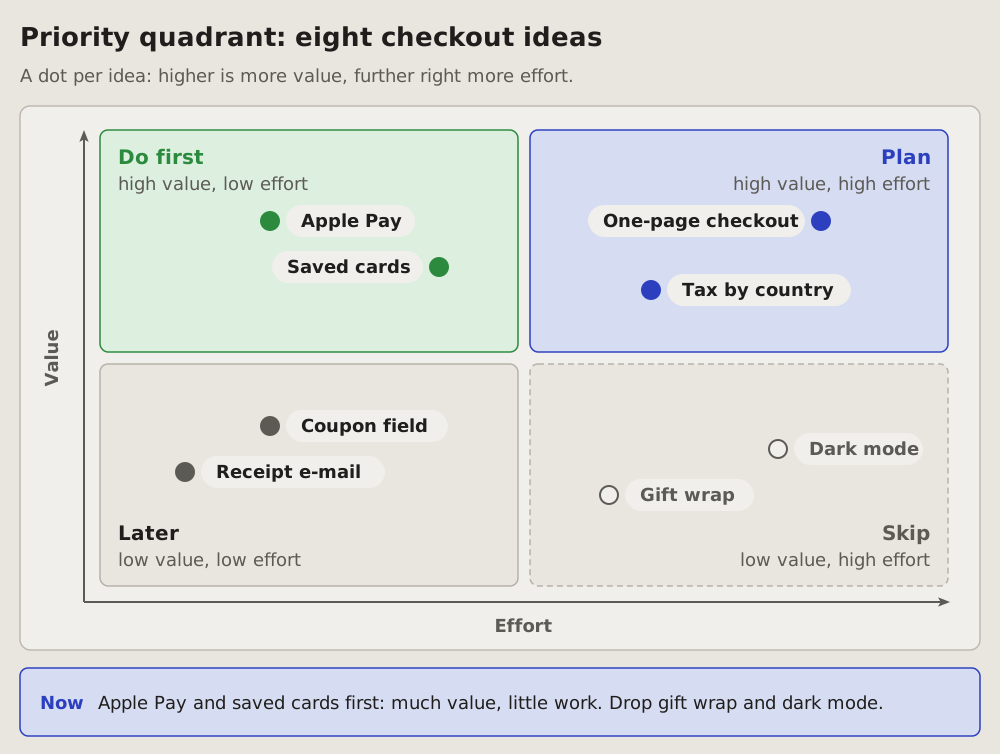
 Priority quadrant
18 Priority quadrant: what to do first
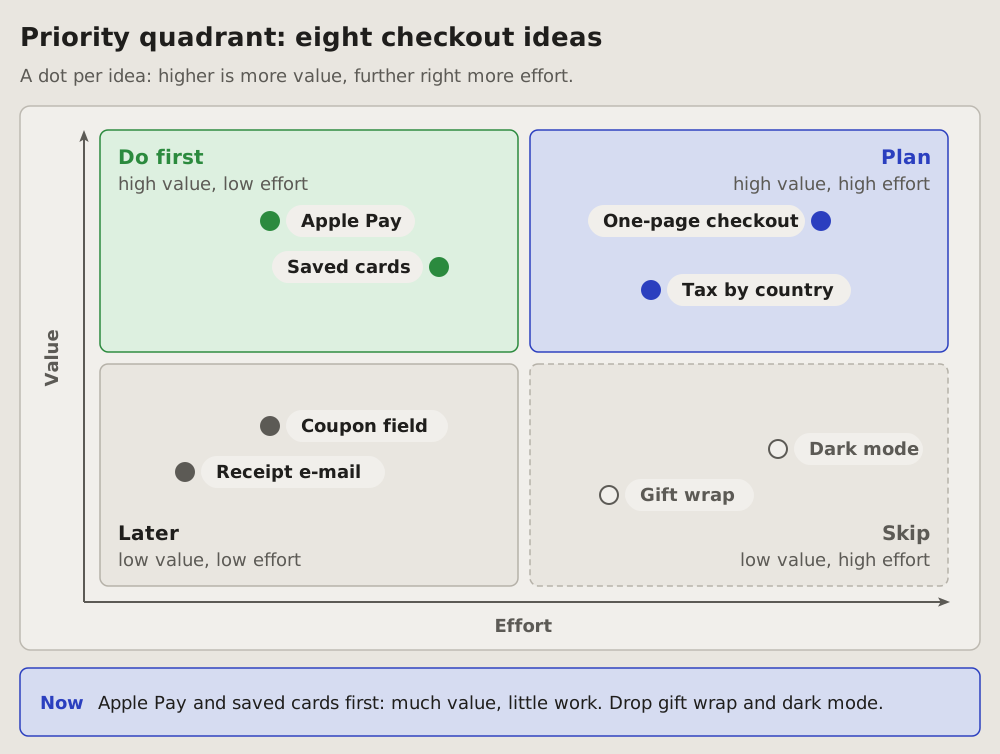
Many pieces of work weighed on two things only: how much each is worth and how much it costs.
 Container sketch (C4)
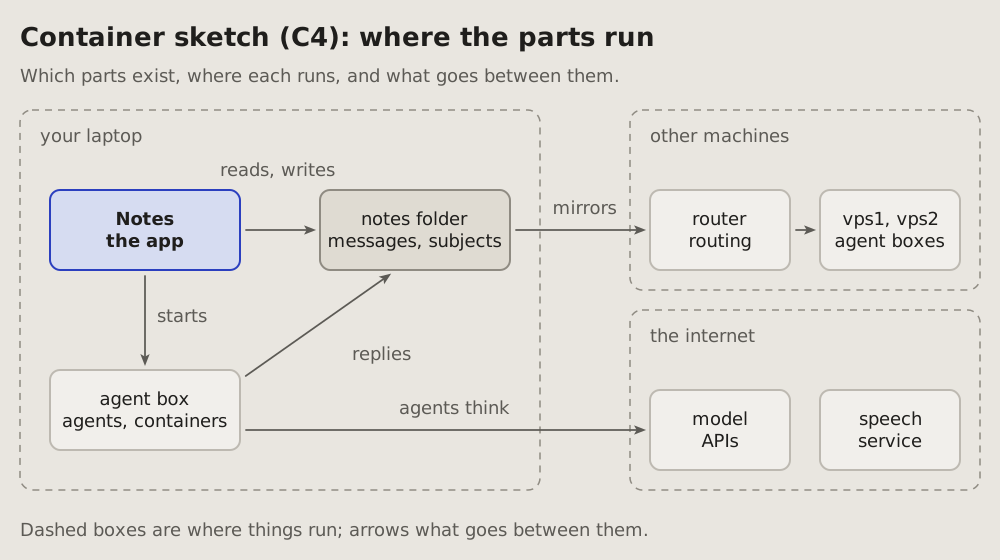
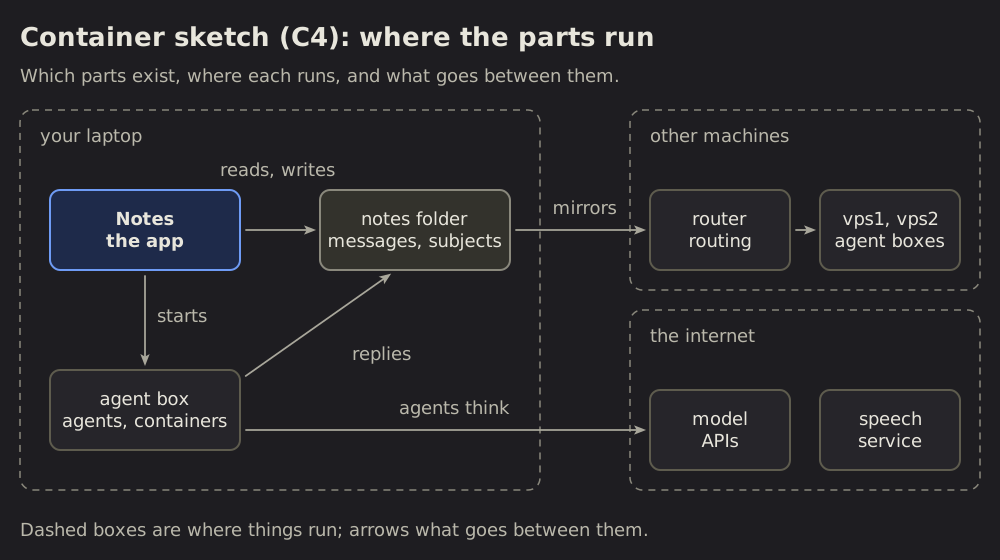
19 Container sketch (C4): where the parts run
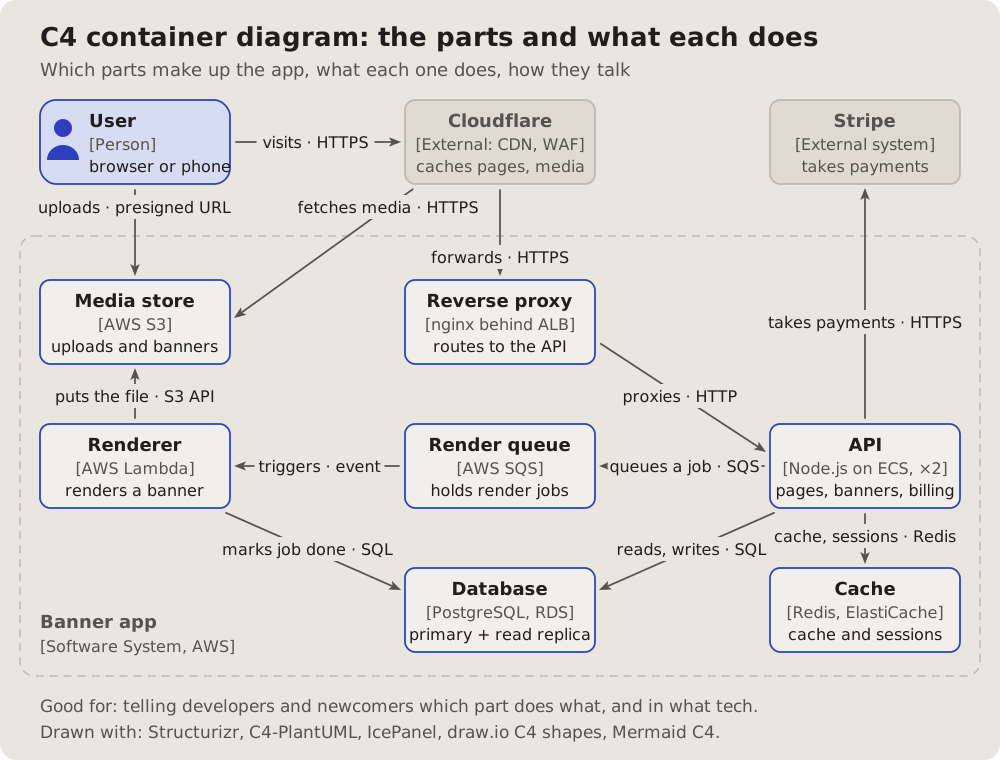
Which parts a system has, where each one runs, and what goes between them: the container level of the C4 model, drawn as a sketch.
 Entity-relationship
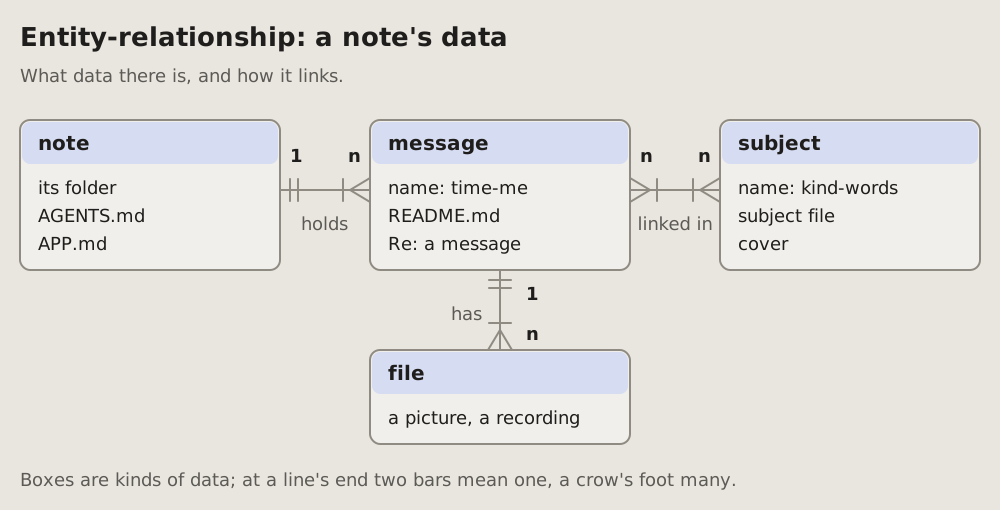
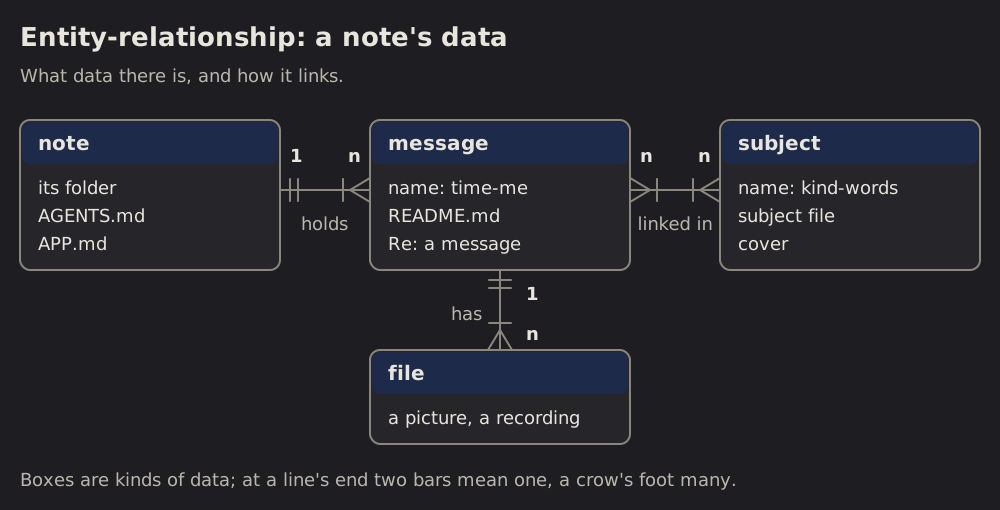
20 Entity-relationship: what data there is and how it links
The kinds of data a system keeps, their main fields, and how many of one go with one of another: 1 to n, n to n, marked on each line's ends.
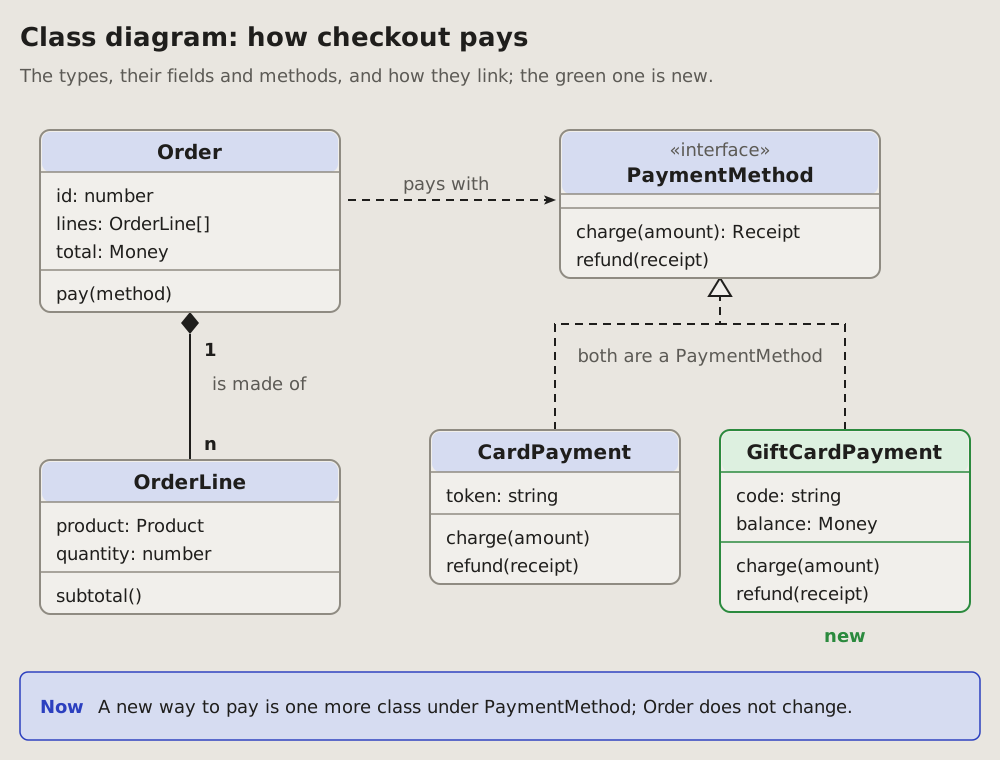
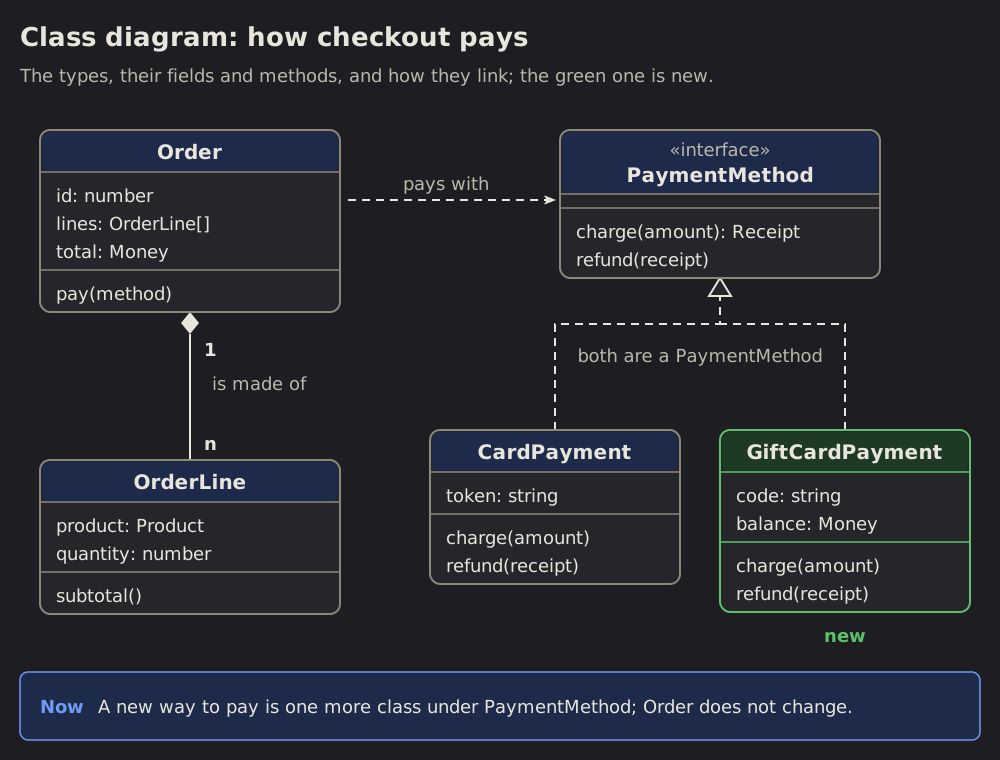 Class diagram
21 Class diagram: the types of a program and how they link
The types of a program as boxes: each with its name, its main fields and its methods.
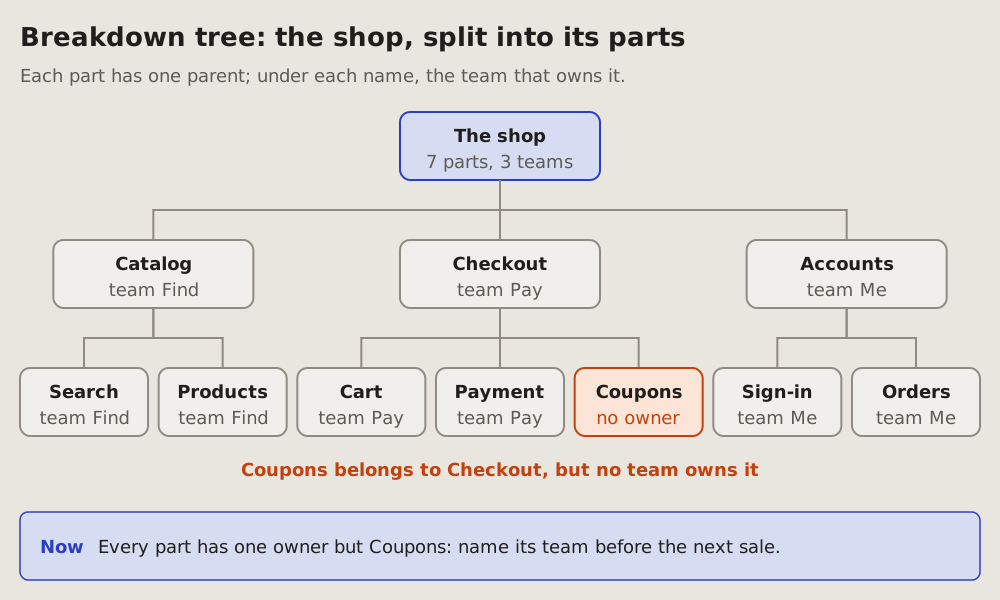
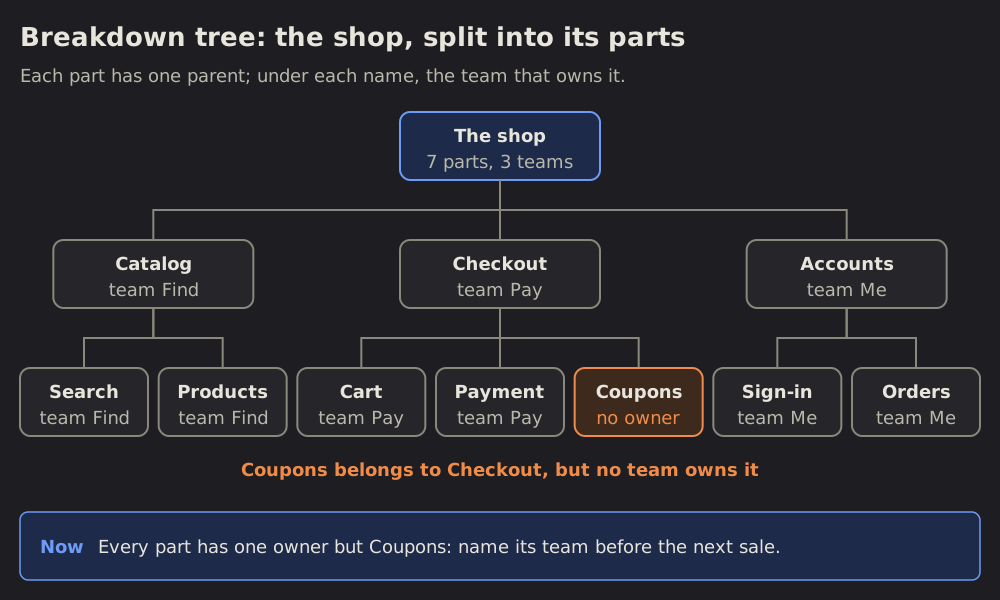 Breakdown tree
22 Breakdown tree: a whole split into its parts
One thing on top, split into its parts, each part into its own, down to the level the question needs.
 Status dashboard
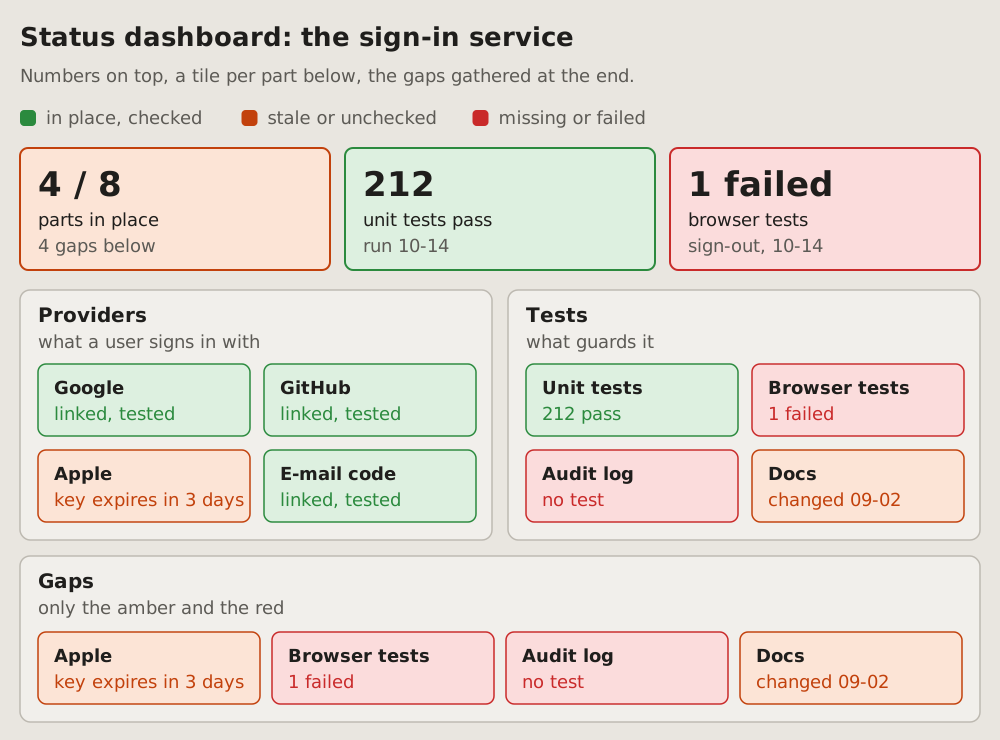
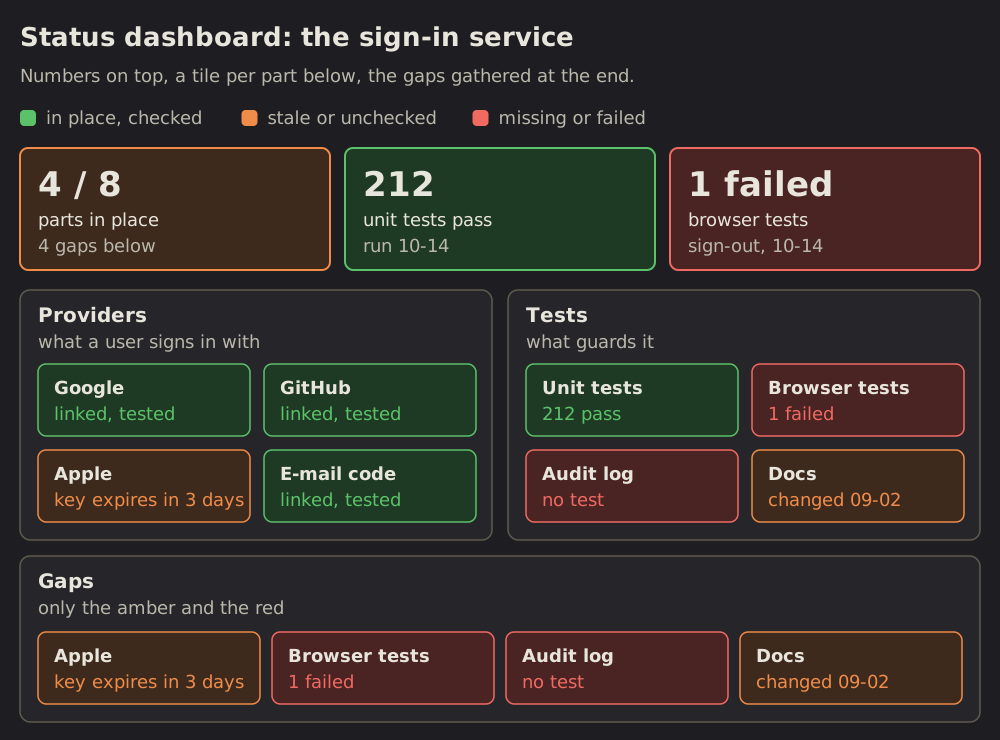
23 Status dashboard: where each part stands
A RAG status dashboard (red, amber, green): the state of many parts at once, each a tile coloured by its state.
 Line chart
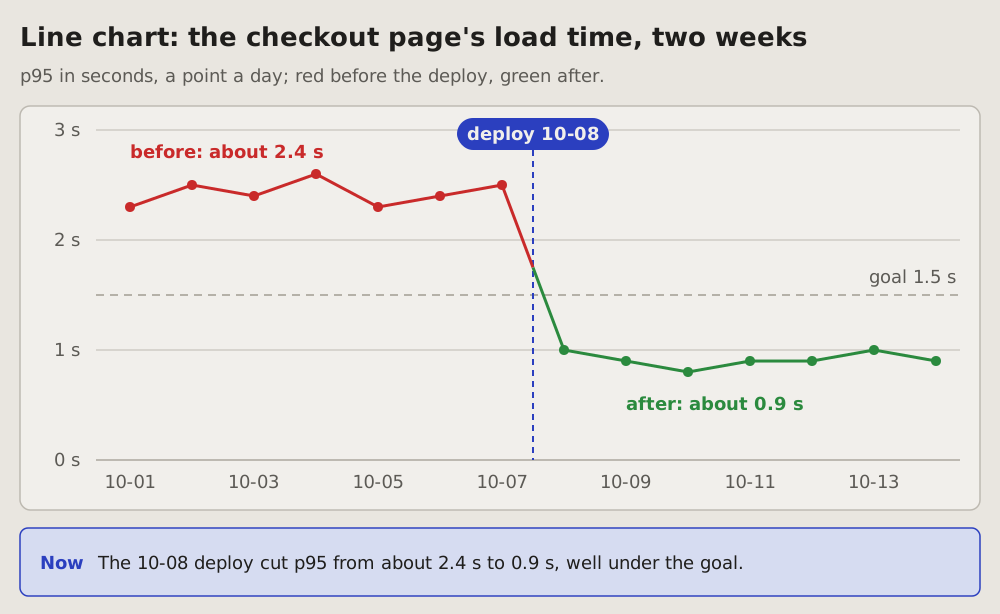
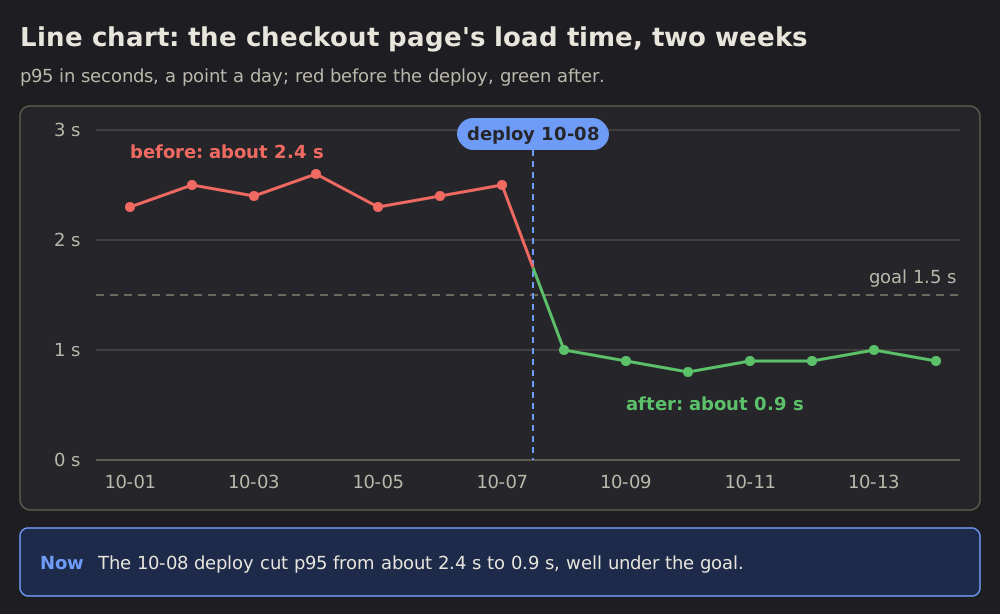
24 Line chart: a number over time
One number over days or hours, a point for each, joined by a line; a dashed line marks the moment something changed, a deploy or a fix.
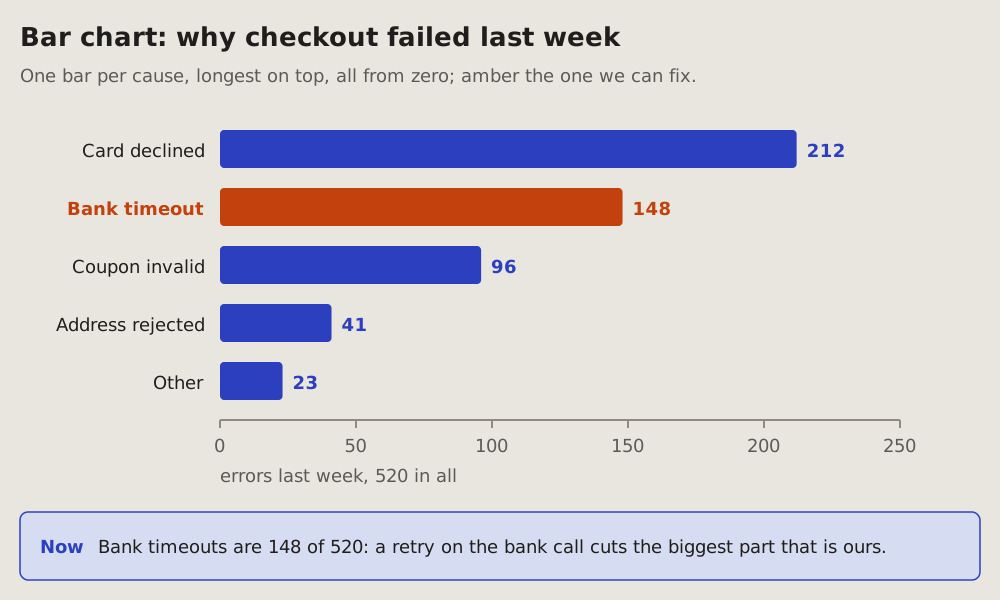
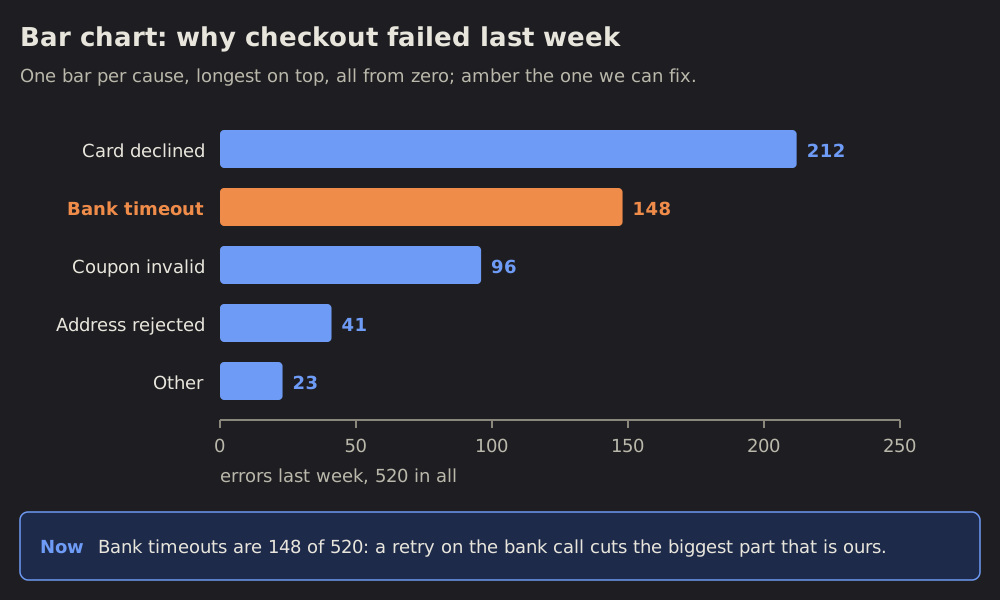 Bar chart
25 Bar chart: how much of each
One bar per thing counted, as long as its count, all from zero, sorted longest first.
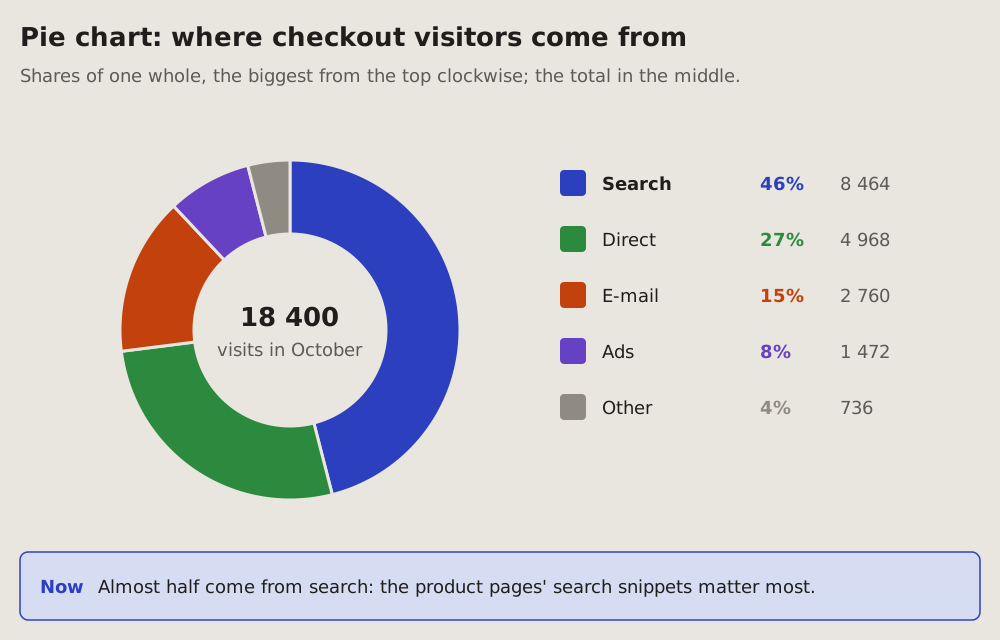
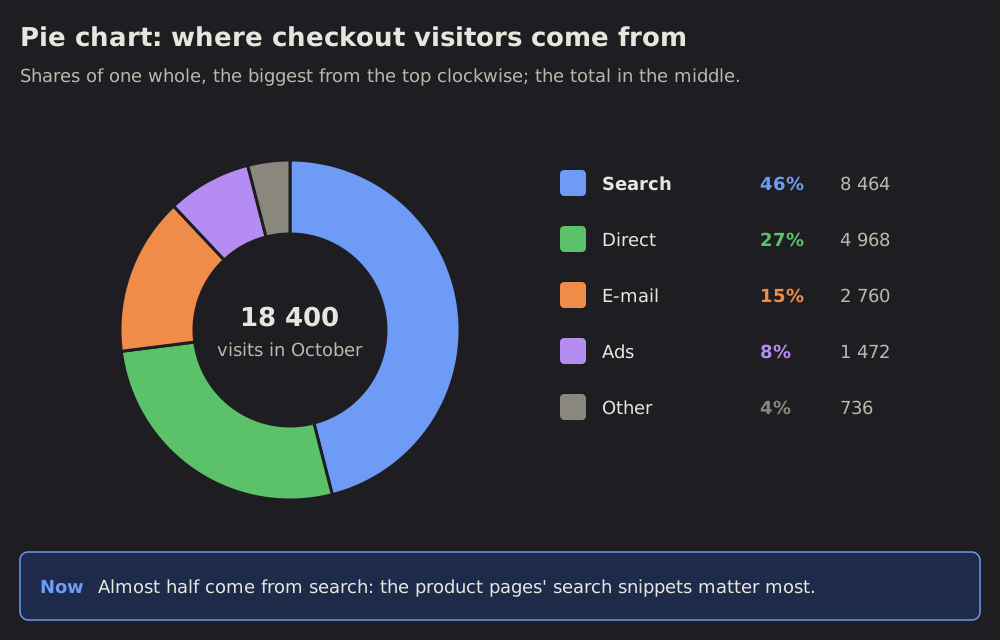 Pie chart
26 Pie chart: shares of one whole
One whole cut into its shares: a ring, each slice as big as its share, the biggest from the top clockwise, the total in the middle.
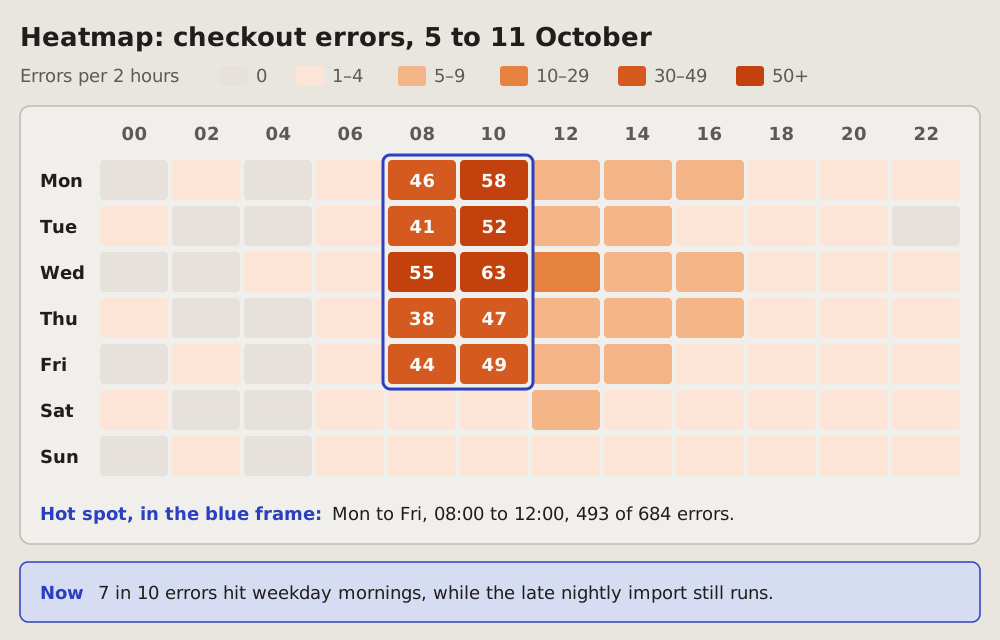
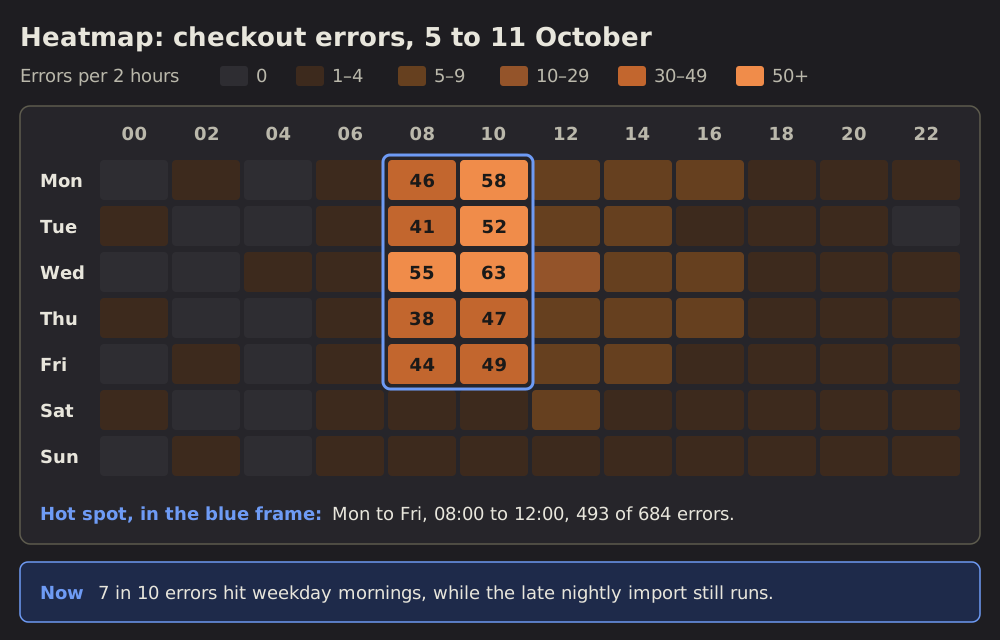 Heatmap
27 Heatmap: when it happens
A week in one grid: the days as rows, the hours as columns, each cell as dark as its count.
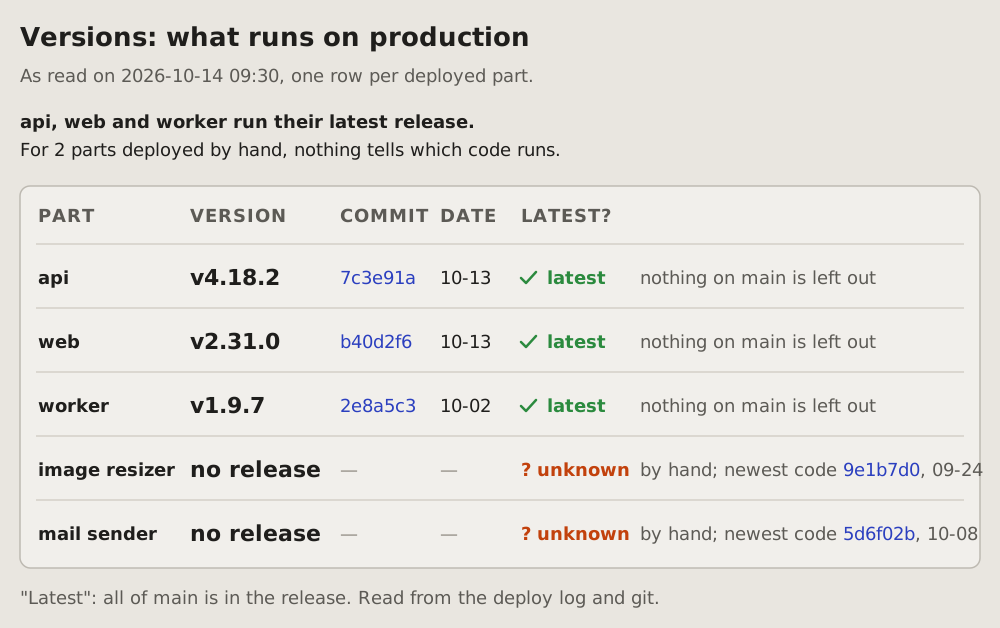
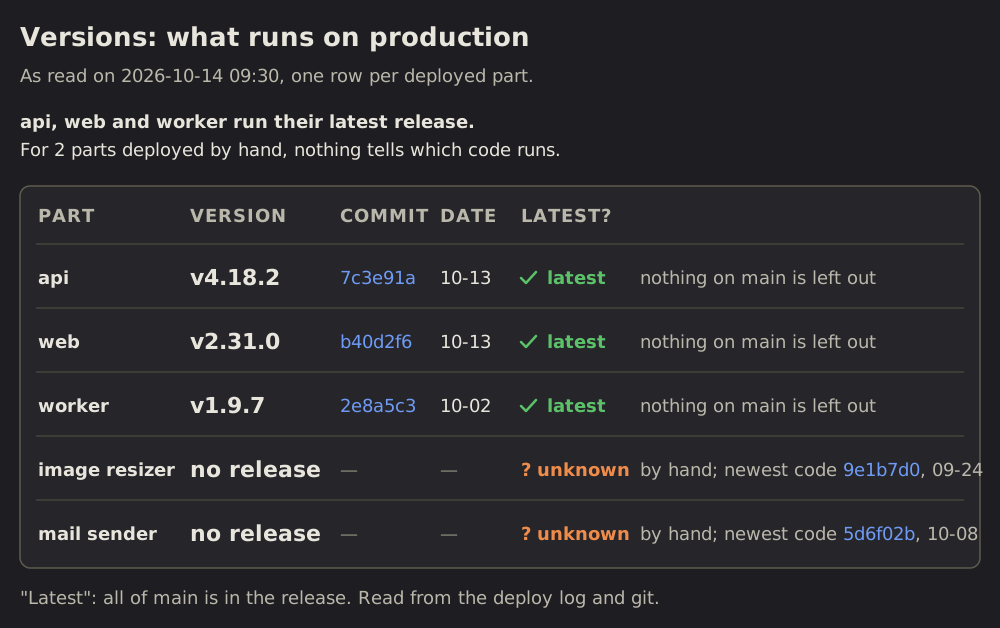 Versions
28 Versions: which version runs where
A table of what is deployed: one row per part, its version, its commit and its date, and whether it is the latest.
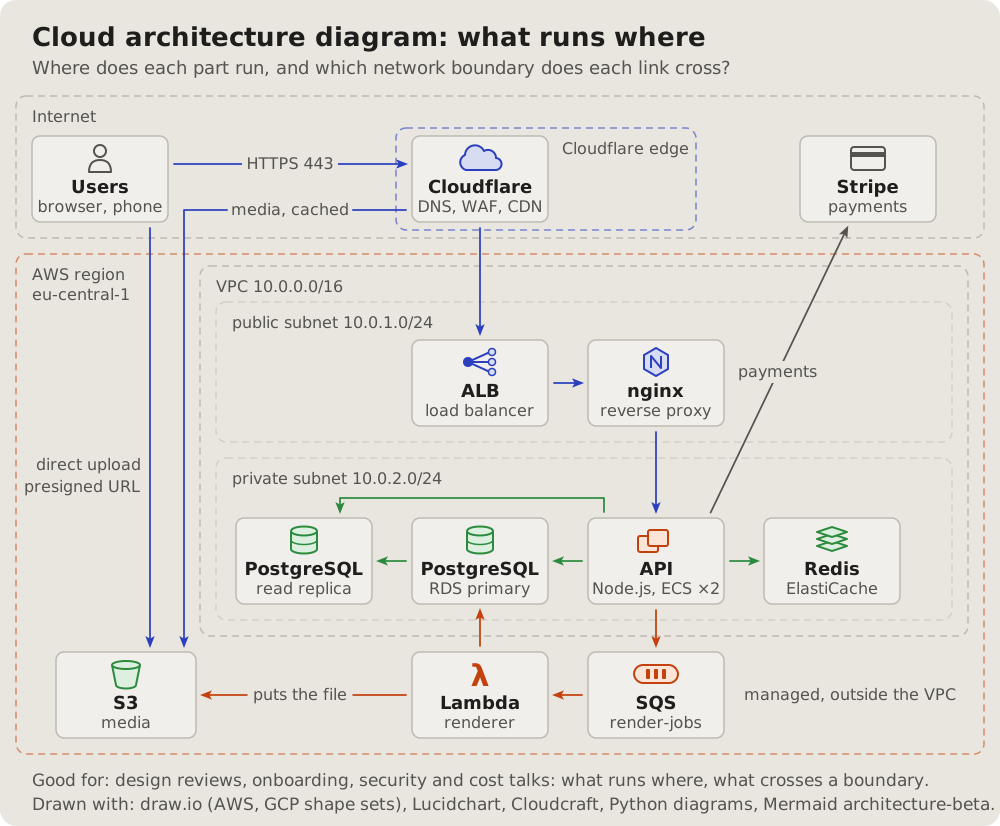
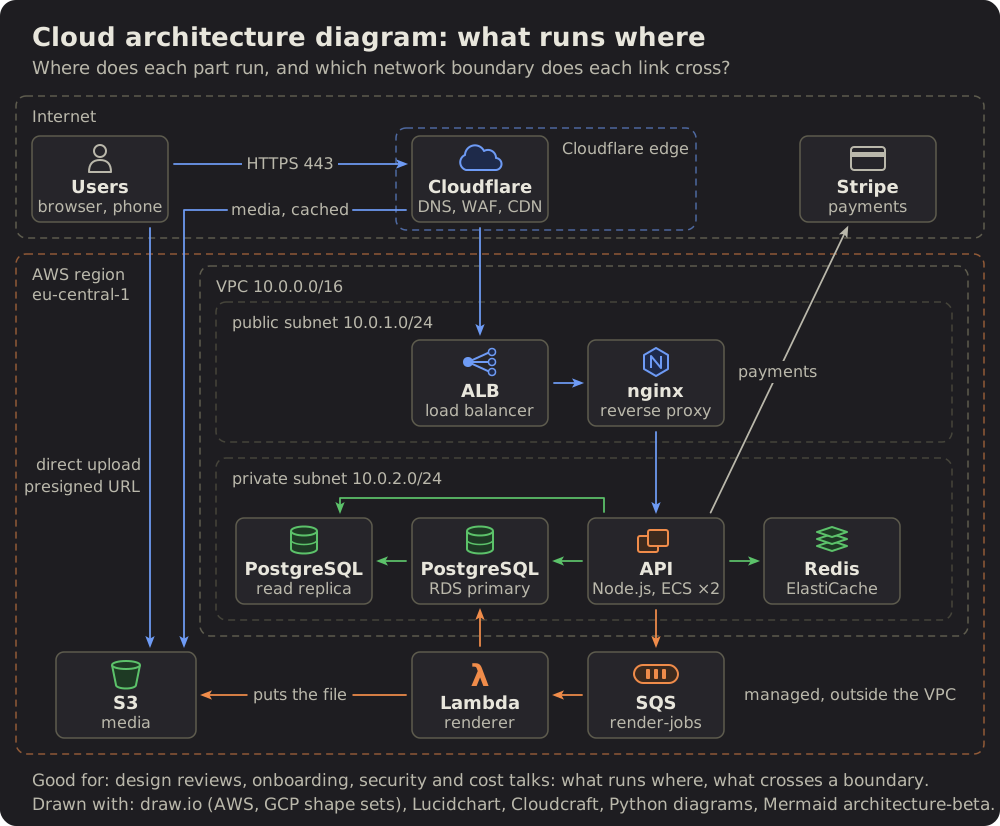 Cloud architecture diagram
29 Cloud architecture diagram: what runs where
The parts of a system inside the places they run: the internet, a CDN's edge, a cloud region, its network and subnets.
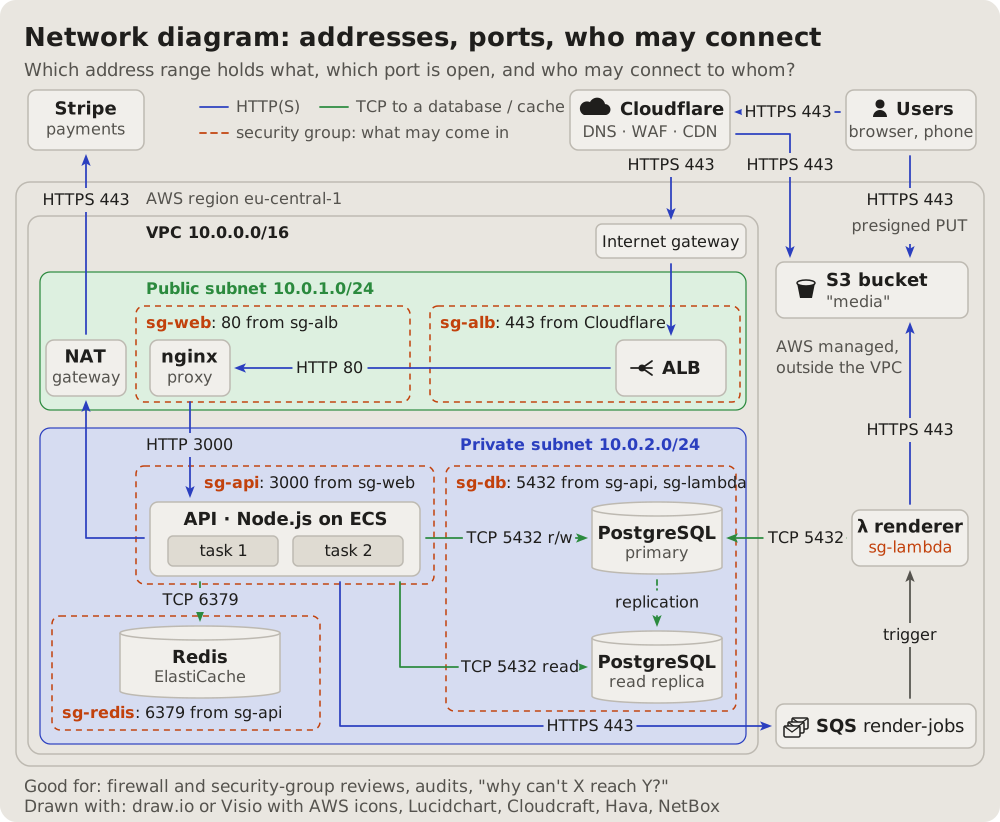
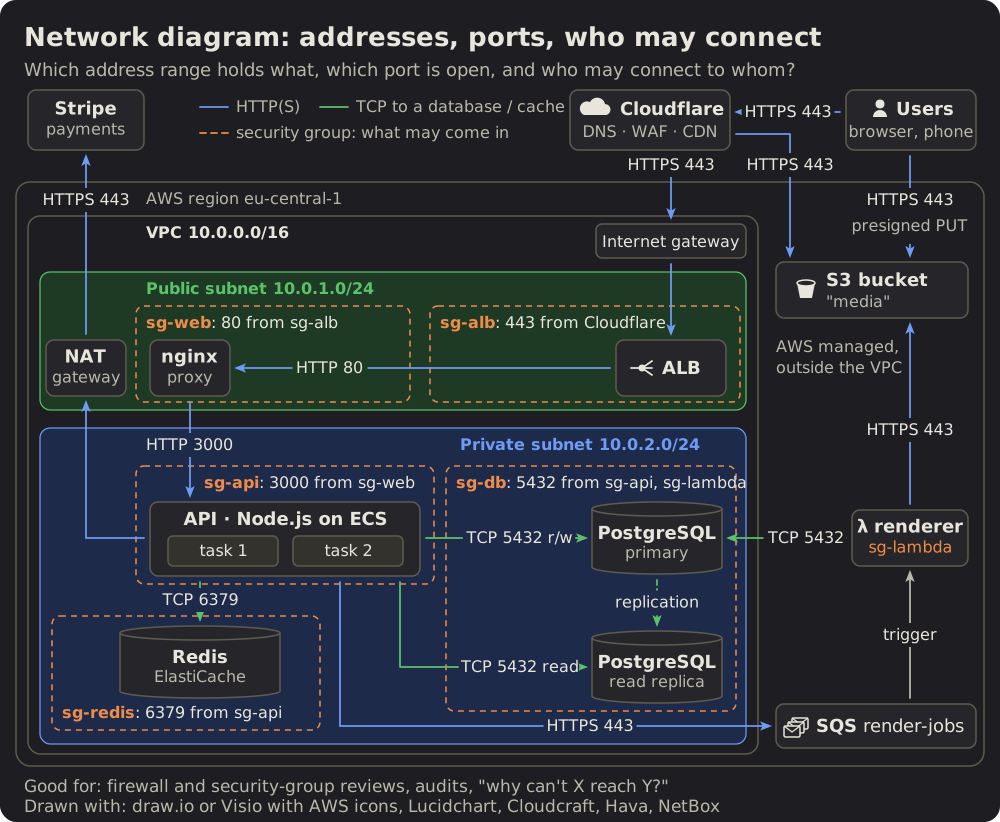 Network diagram
30 Network diagram: addresses, ports, who may connect
The network engineer's view: address ranges as bands, the gateways at their borders.
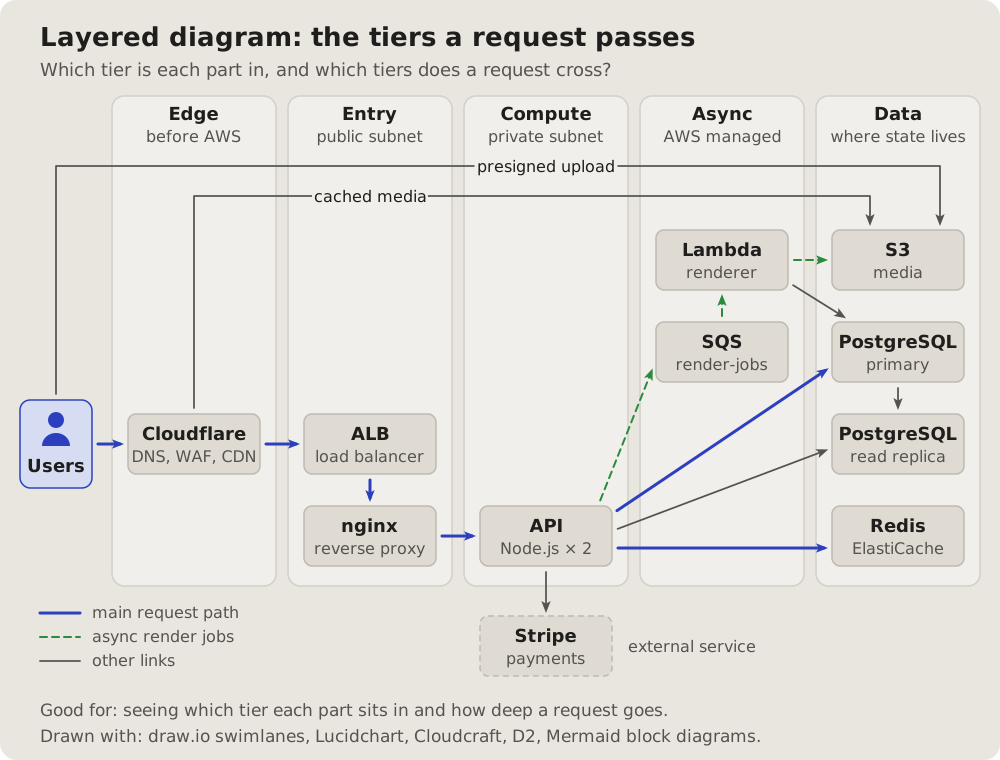
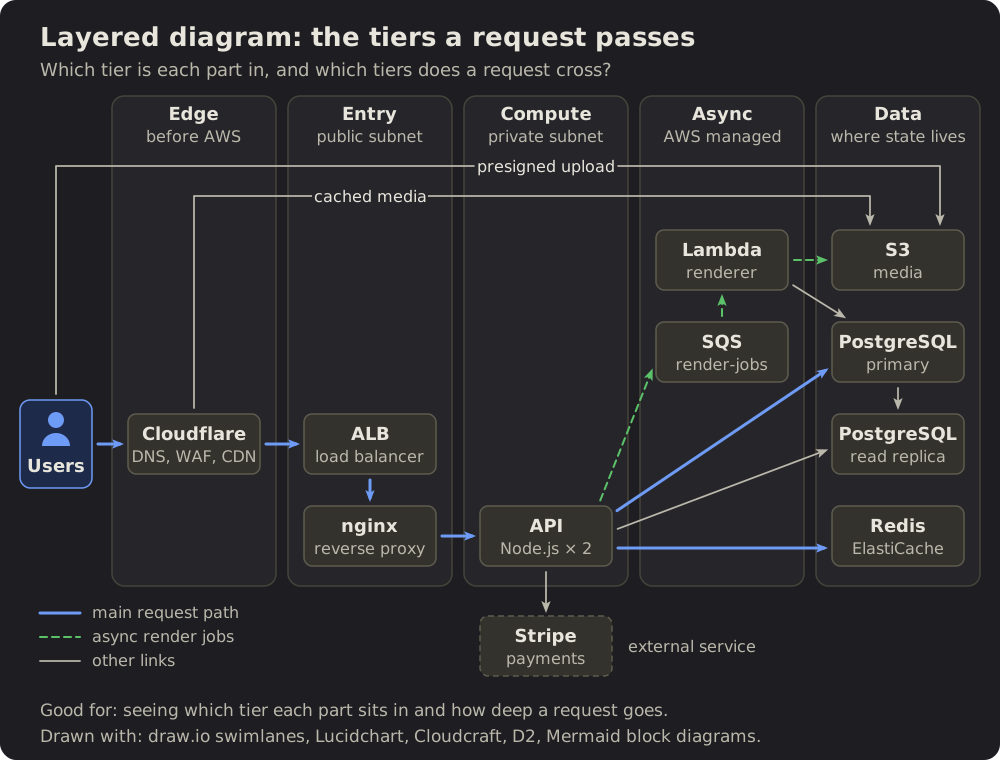 Layered diagram
31 Layered diagram: the tiers a request passes
The parts in columns by tier, left to right in the order a request meets them.
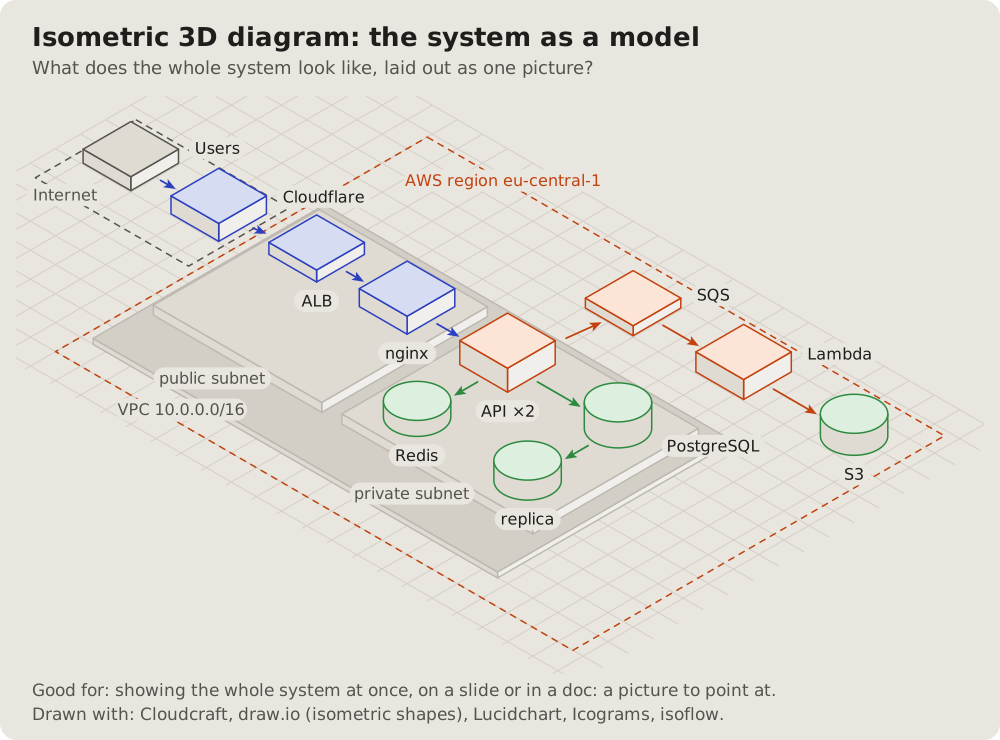
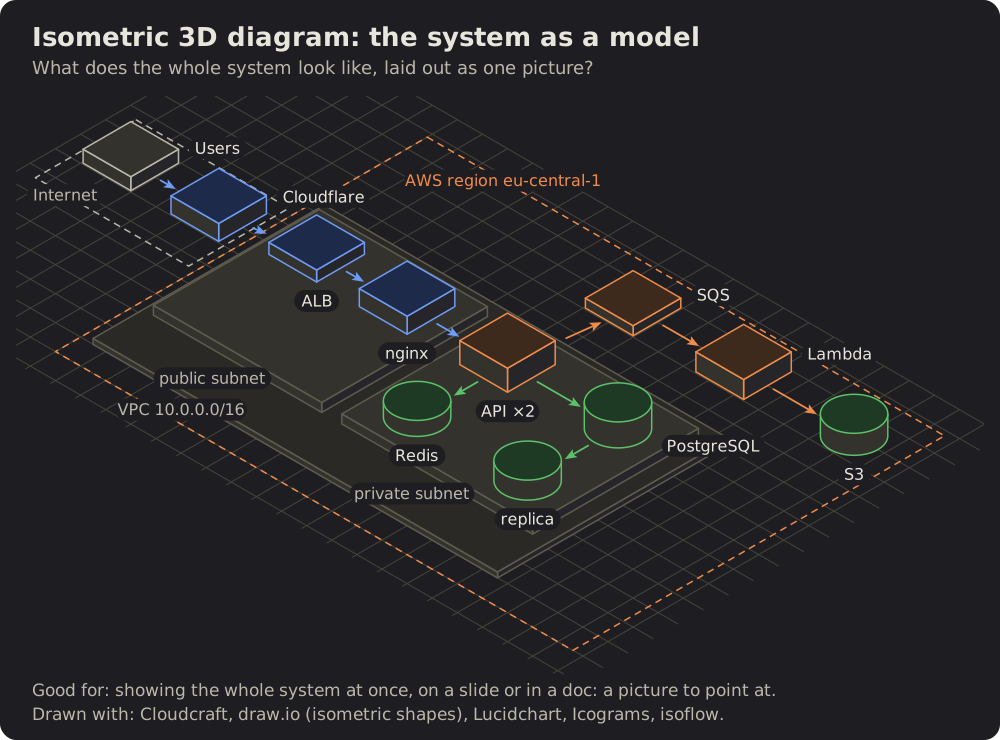 Isometric diagram
32 Isometric diagram: the system as a model
The same parts as blocks on an isometric floor, the networks as raised platforms, the main paths along the grid.
 Service map
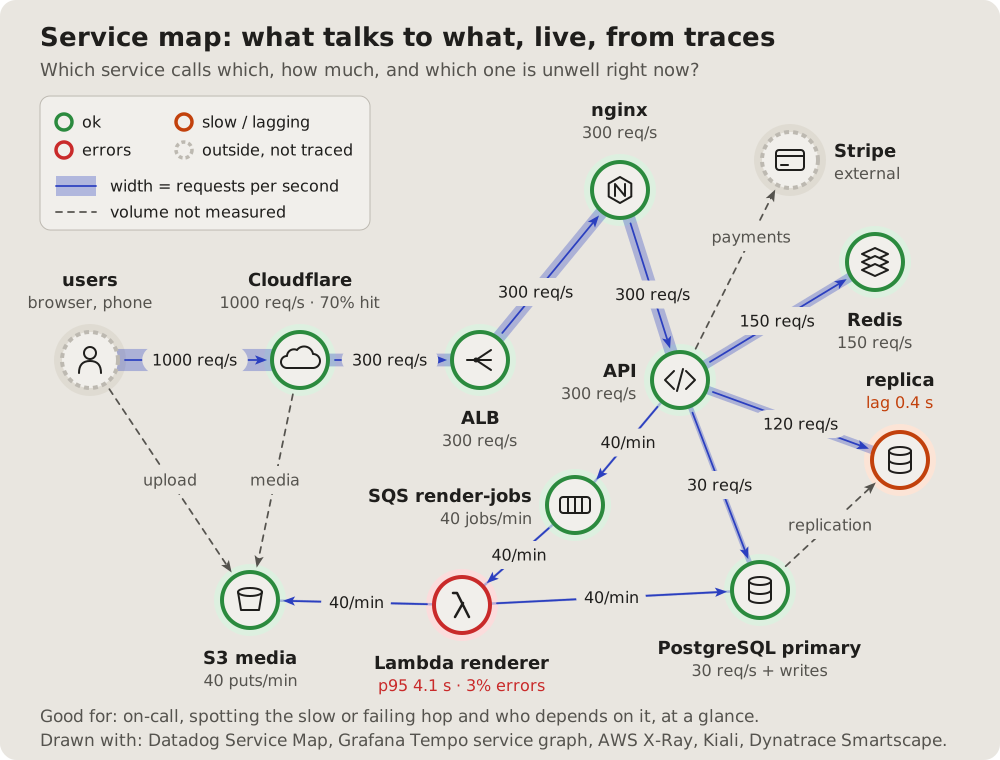
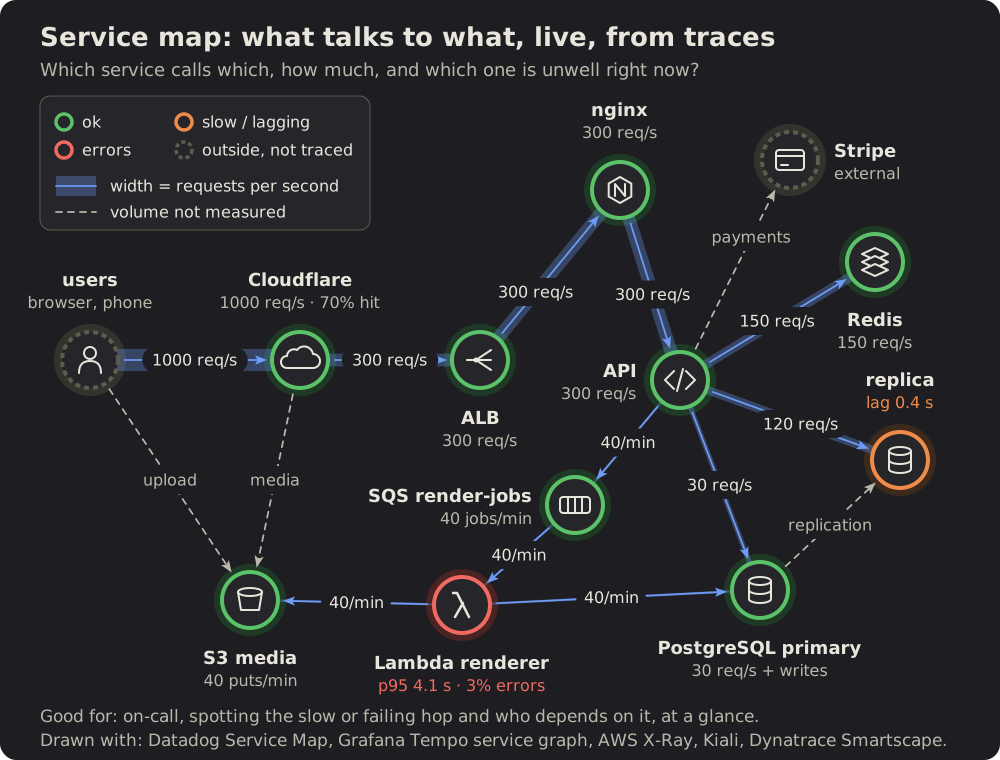
33 Service map: what talks to what, live
What a tracing tool draws from real traffic: each service a circle with a ring for its health, each link as thick as its traffic.
 Sankey diagram
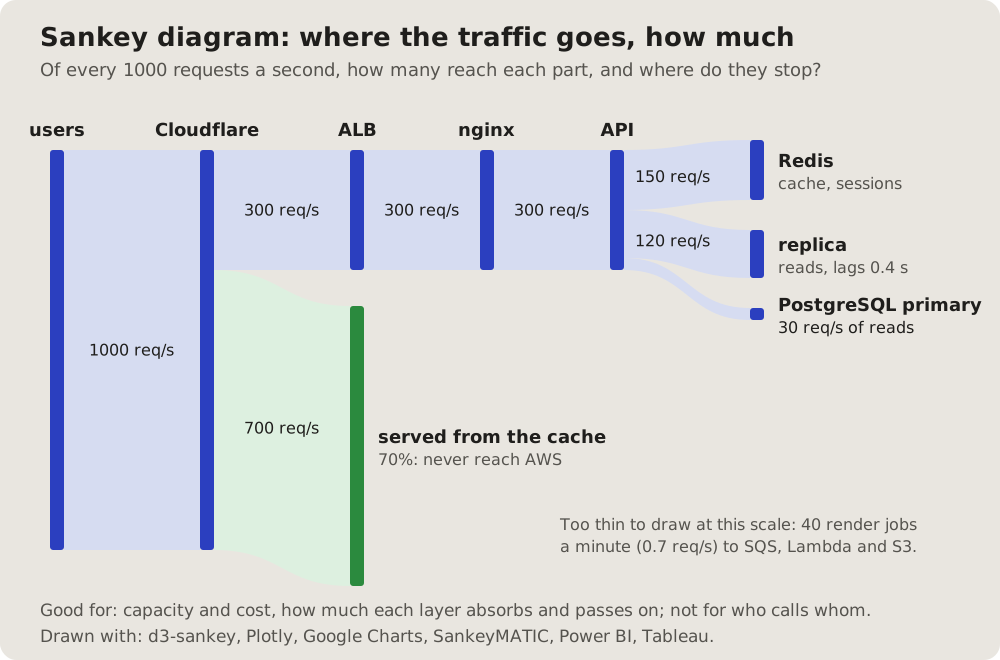
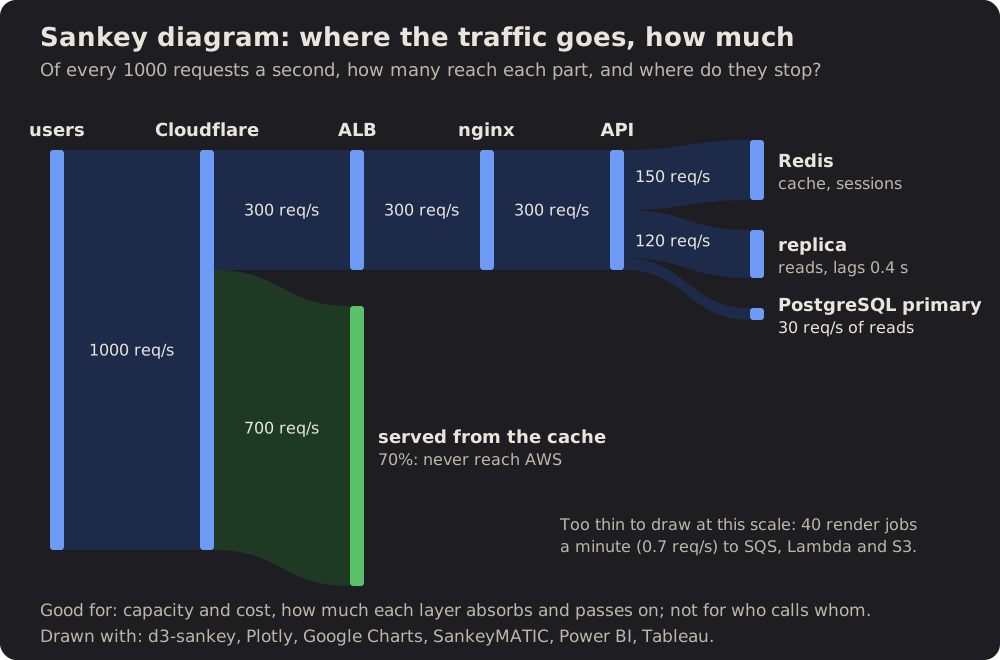
34 Sankey diagram: where the traffic goes, how much
Traffic as bands that split and end, each as wide as its share: what a cache absorbs, what reaches each part behind it.
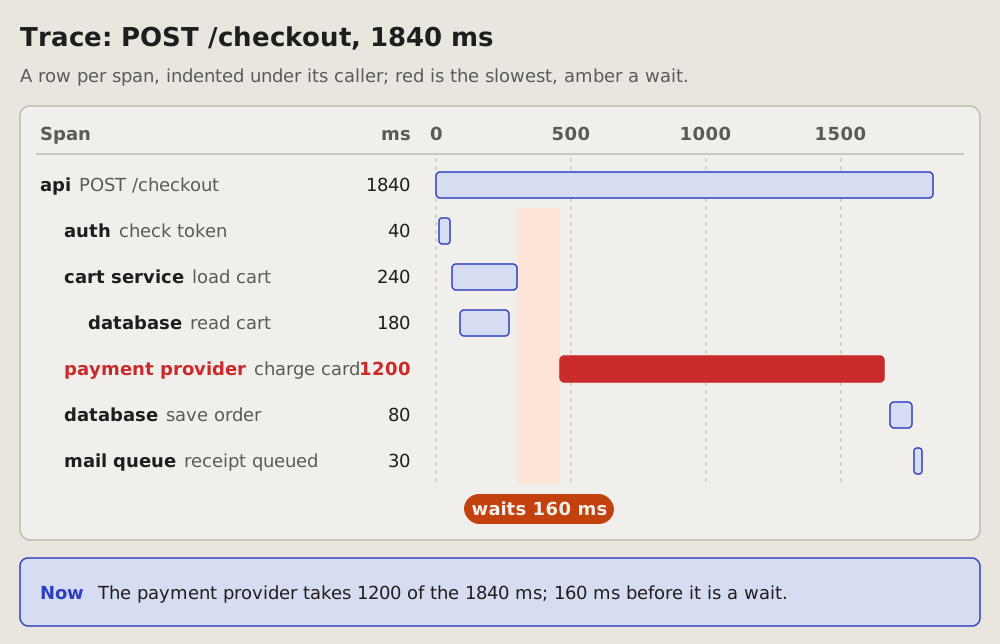
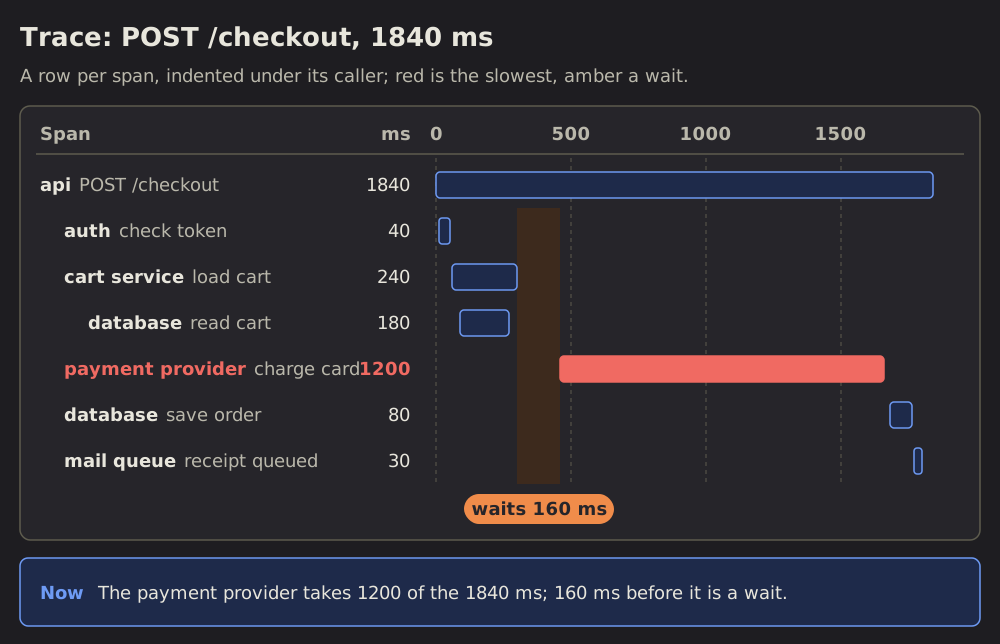 Trace waterfall
35 Trace waterfall: where one request spends its time
One request traced across services: a row per span, each a bar from its start to its end on one scale of milliseconds.
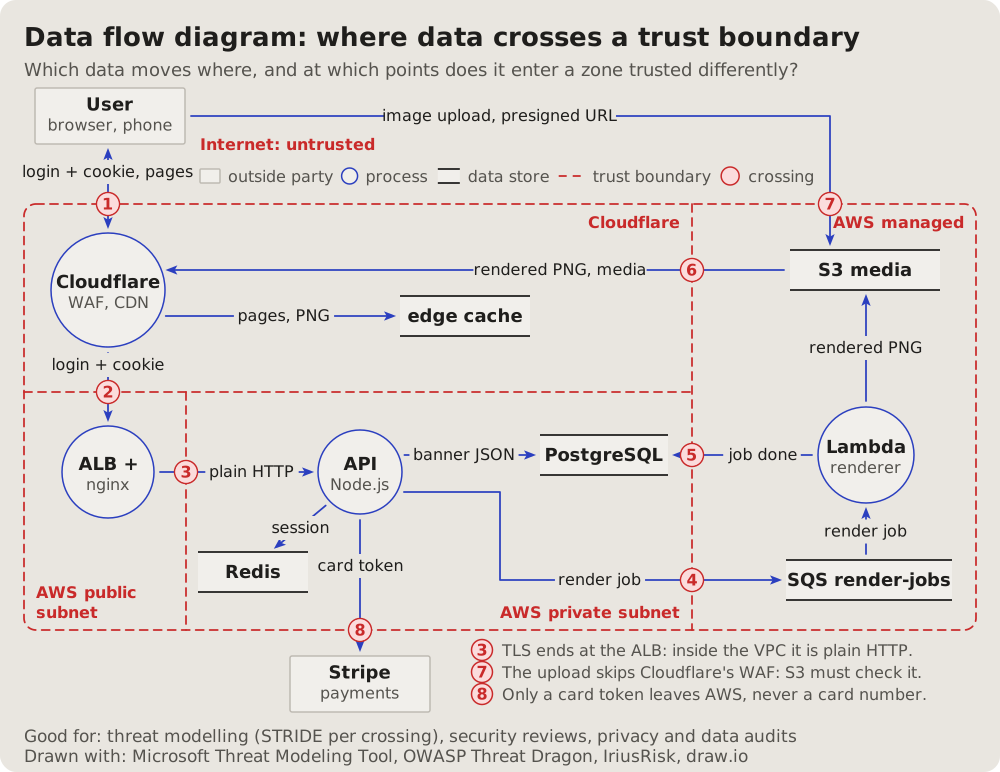
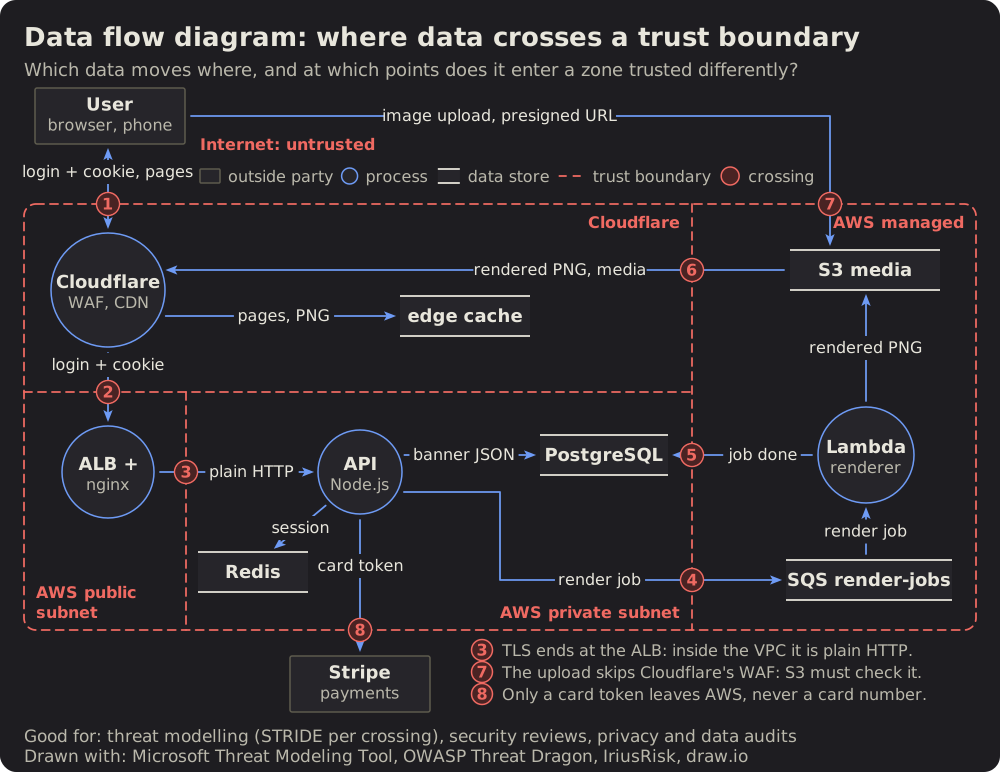 Data flow diagram
36 Data flow diagram: where data crosses a trust boundary
The threat modeller's view: outside parties, processes and data stores, the flows between them labelled with the data they carry.
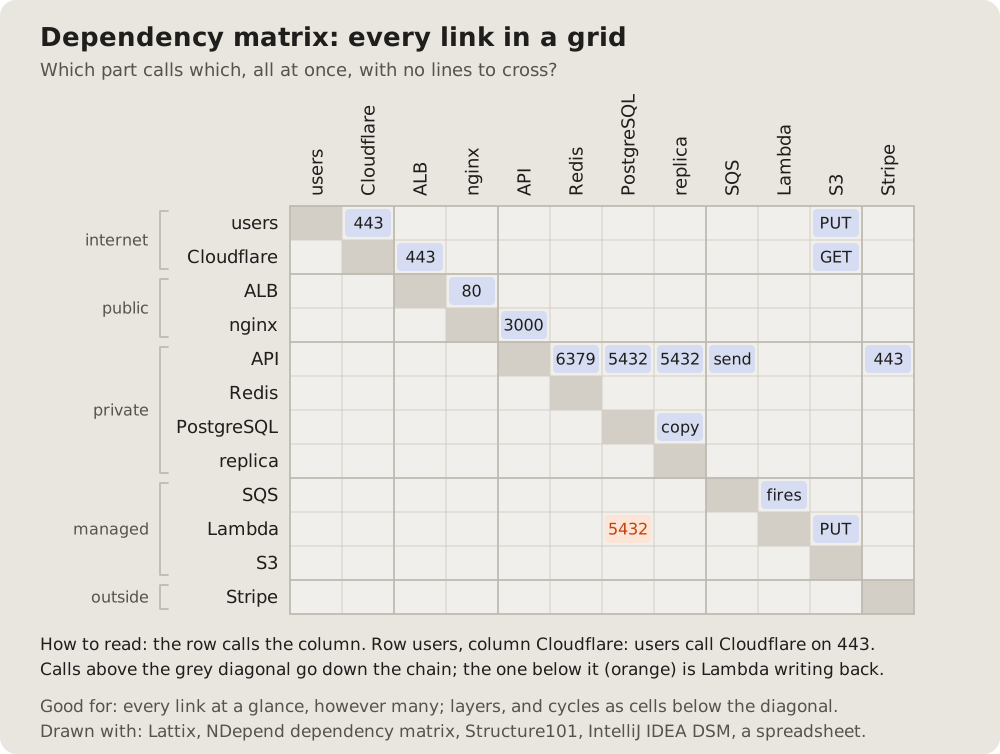
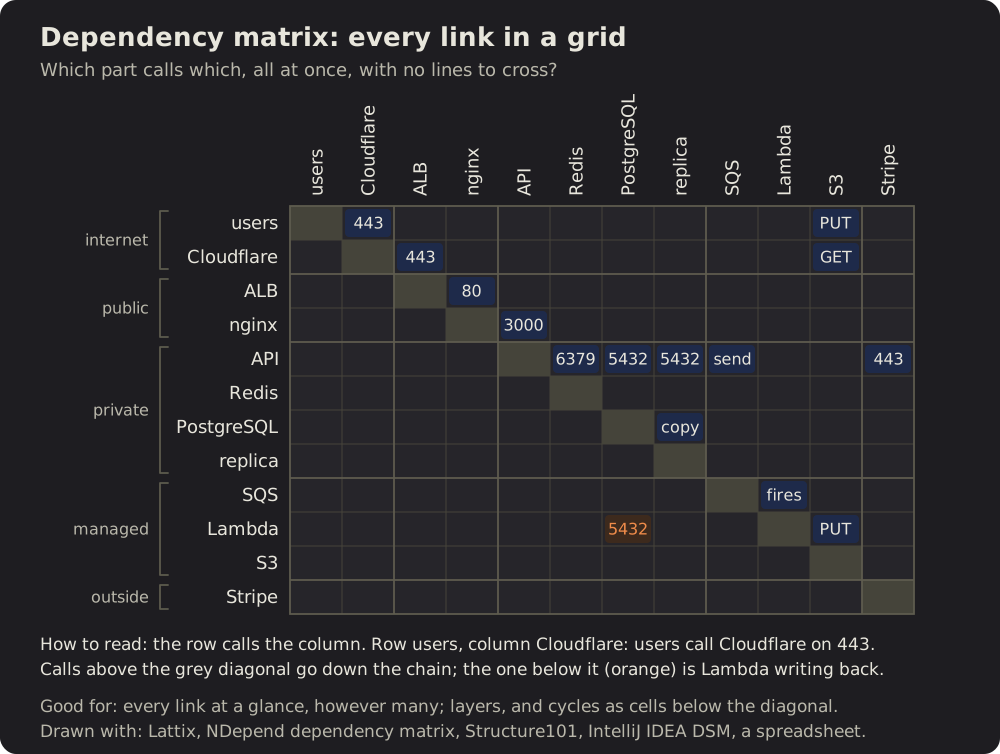 Dependency matrix
37 Dependency matrix: every link in a grid
The parts as rows and the same parts as columns; a filled cell where the row calls the column.
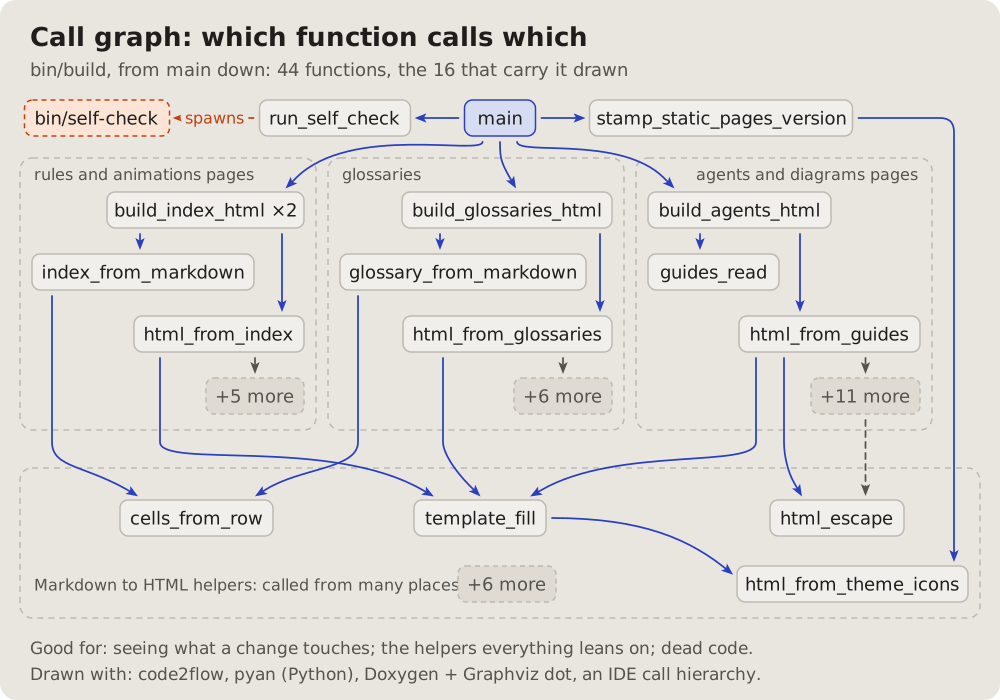
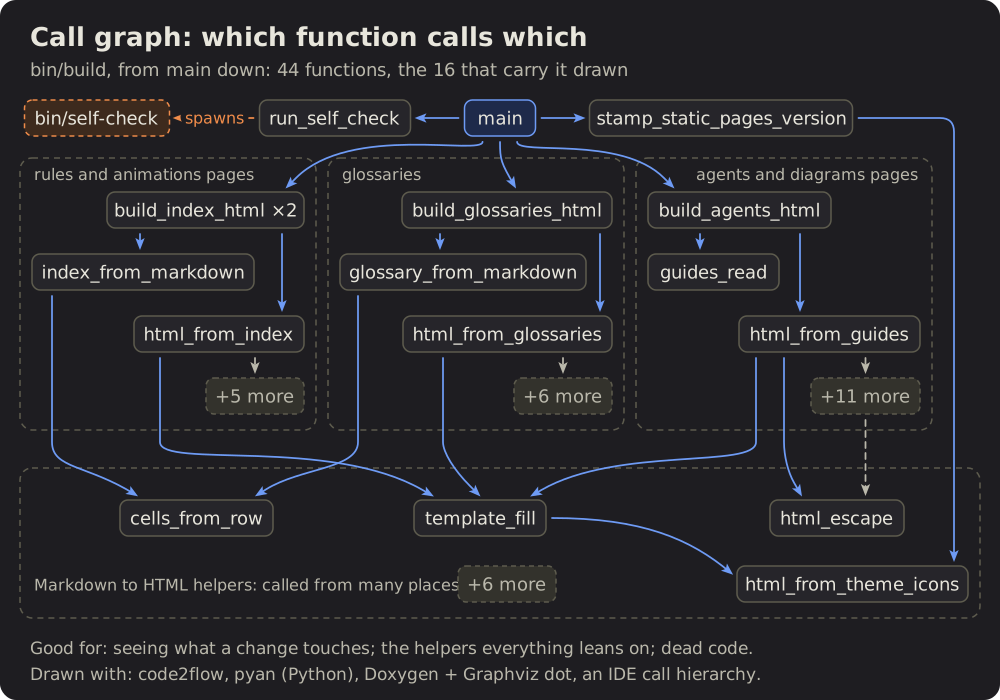 Call graph
38 Call graph: which function calls which
A program from its entry down: each function a box, an arrow to each one it calls, the related ones framed together.
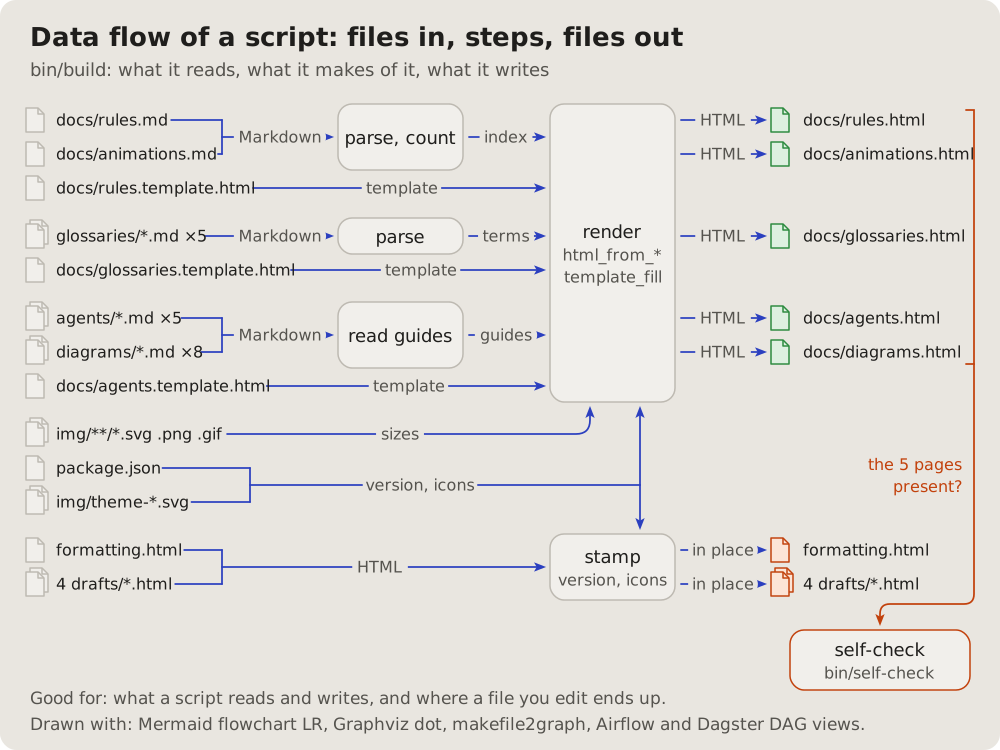
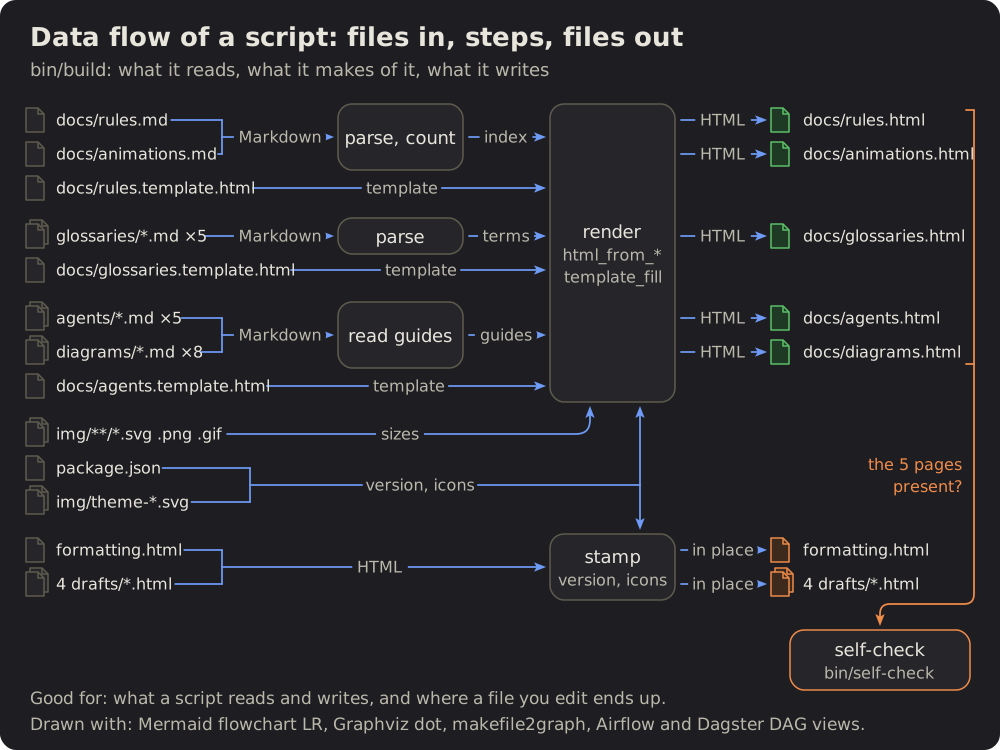 Data flow of a script
39 Data flow of a script: files in, steps, files out
What a script reads on the left, the steps it makes of it in the middle, what it writes on the right.
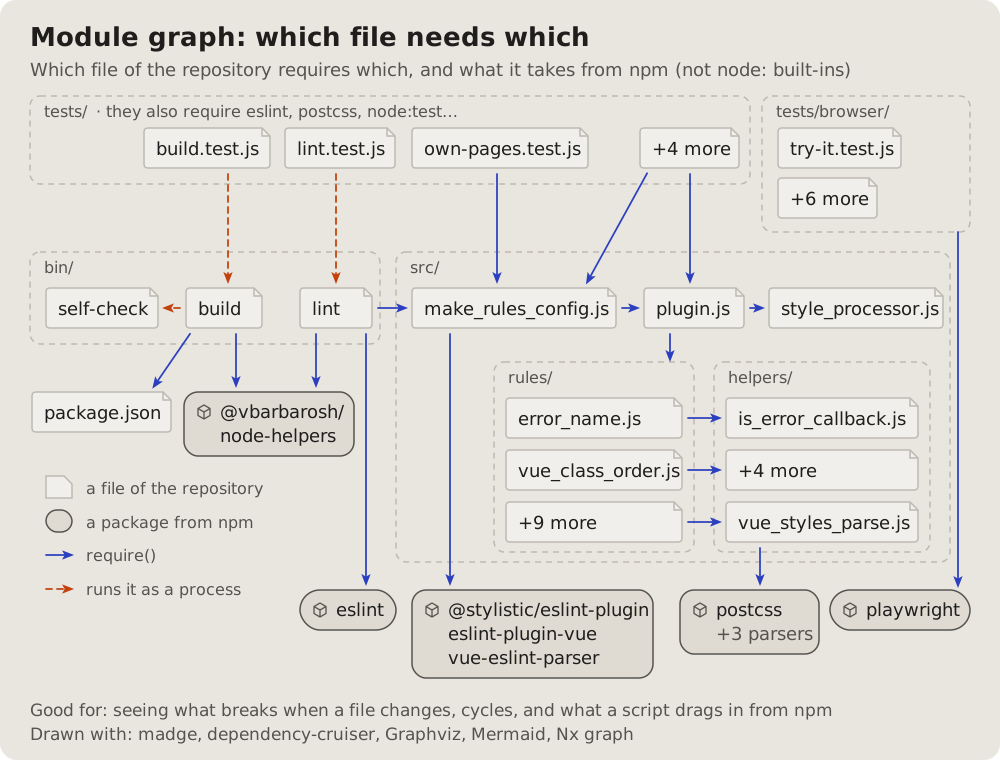
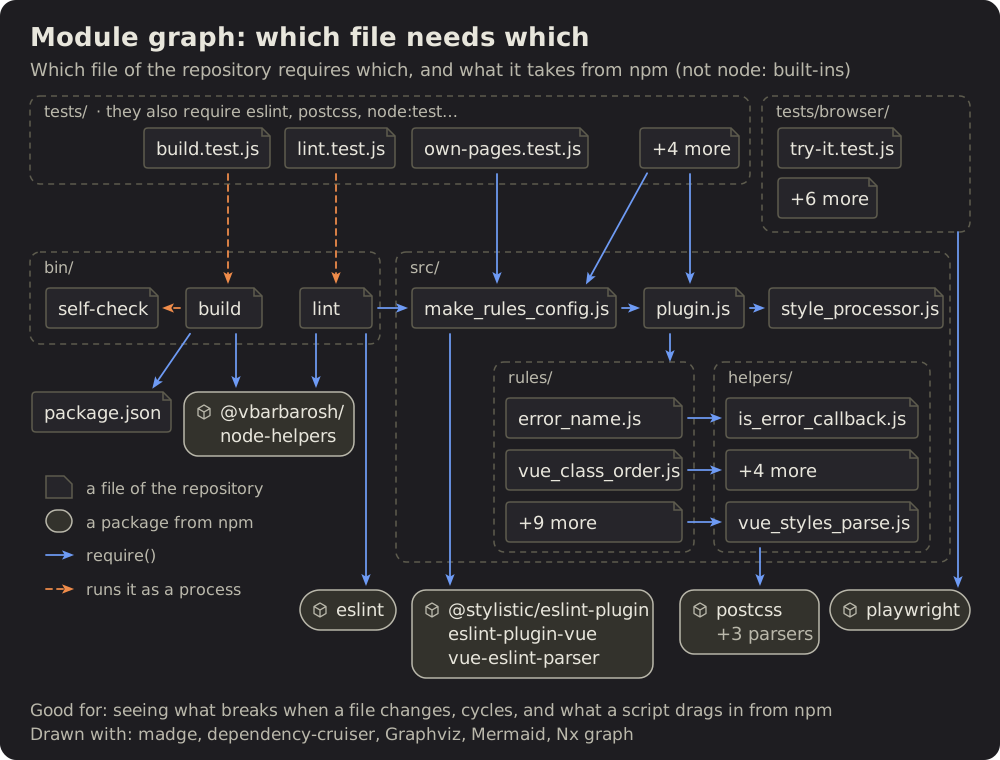 Module graph
40 Module graph: which file needs which
The files of a project as boxes in their folders, an arrow from each file to each one it requires.
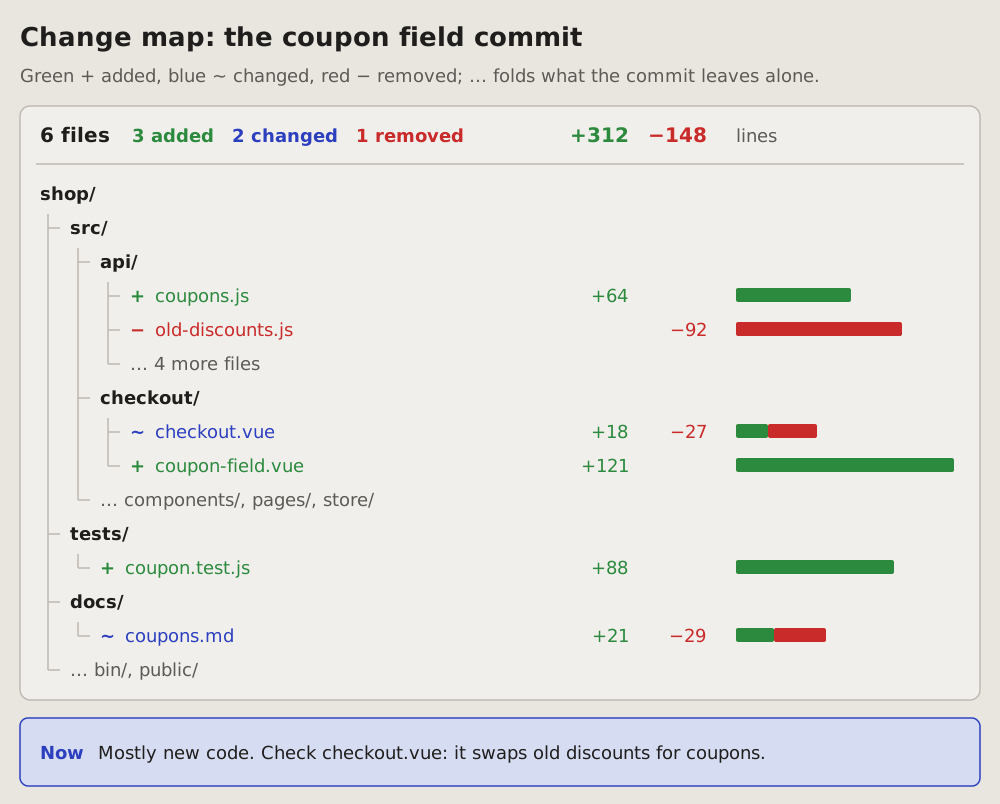
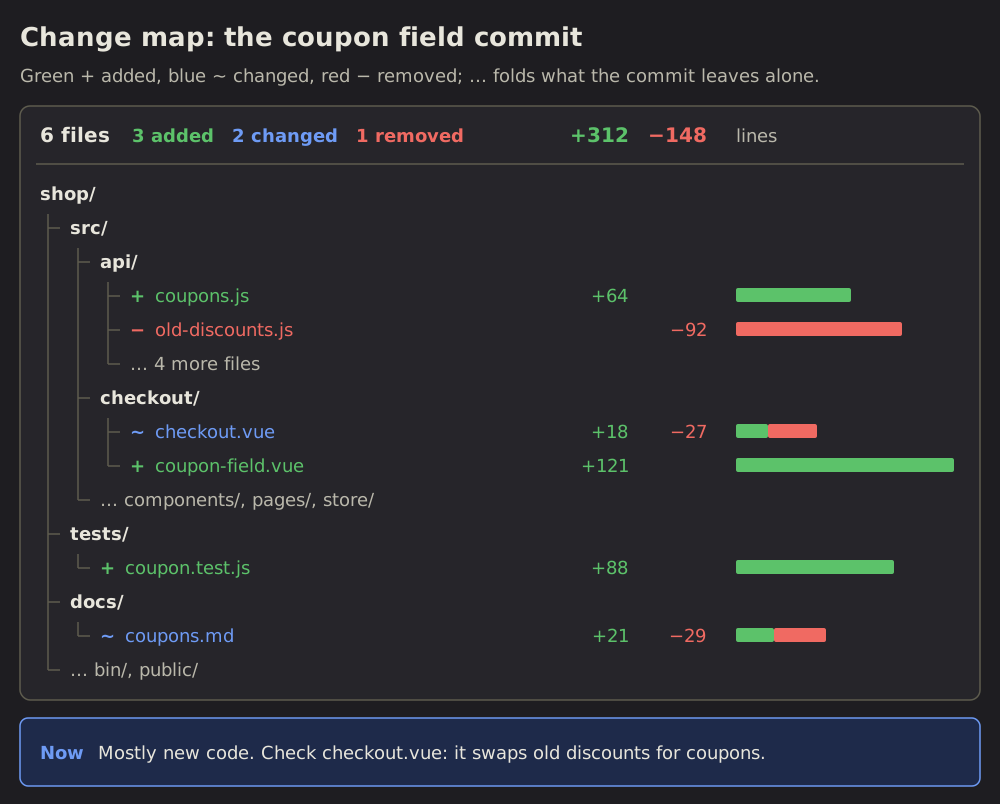 Change map
41 Change map: what a change touches
The project's folder tree, trimmed to the files one change touches.
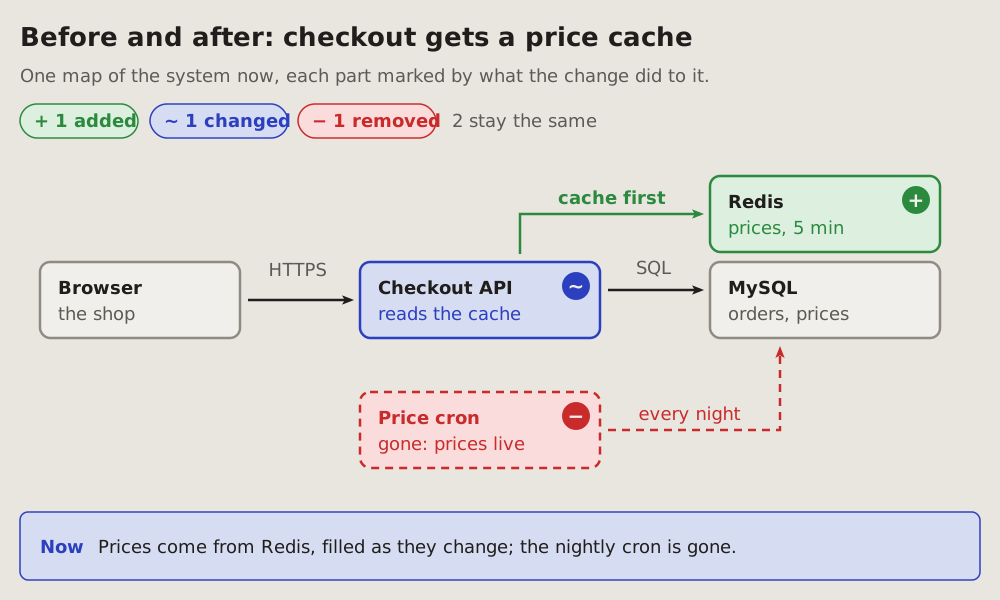
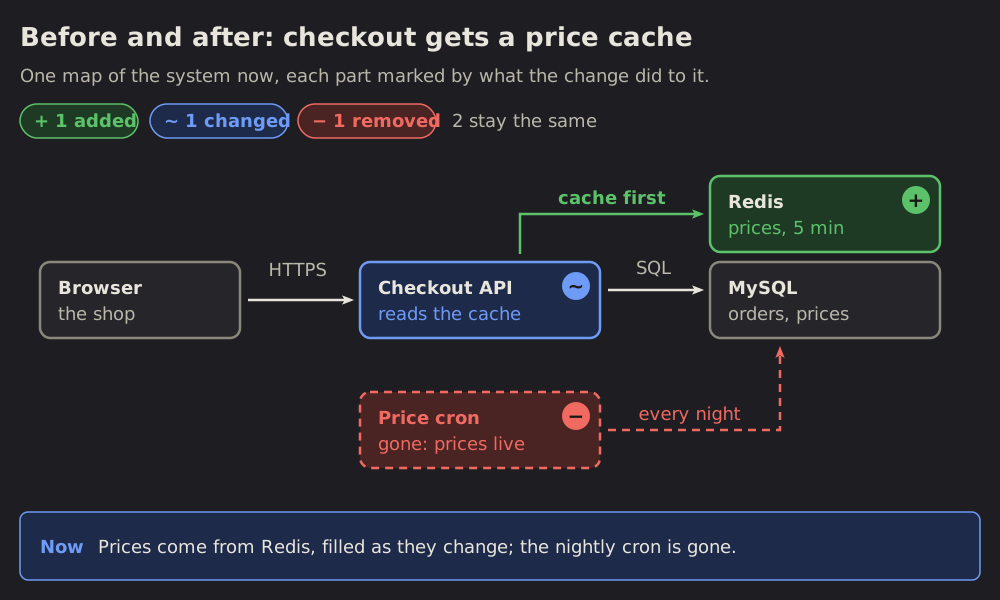 Before and after
42 Before and after: what a change does to a system
One map of a system as it is after a change, each part marked by what the change did to it: added, changed, removed or the same.
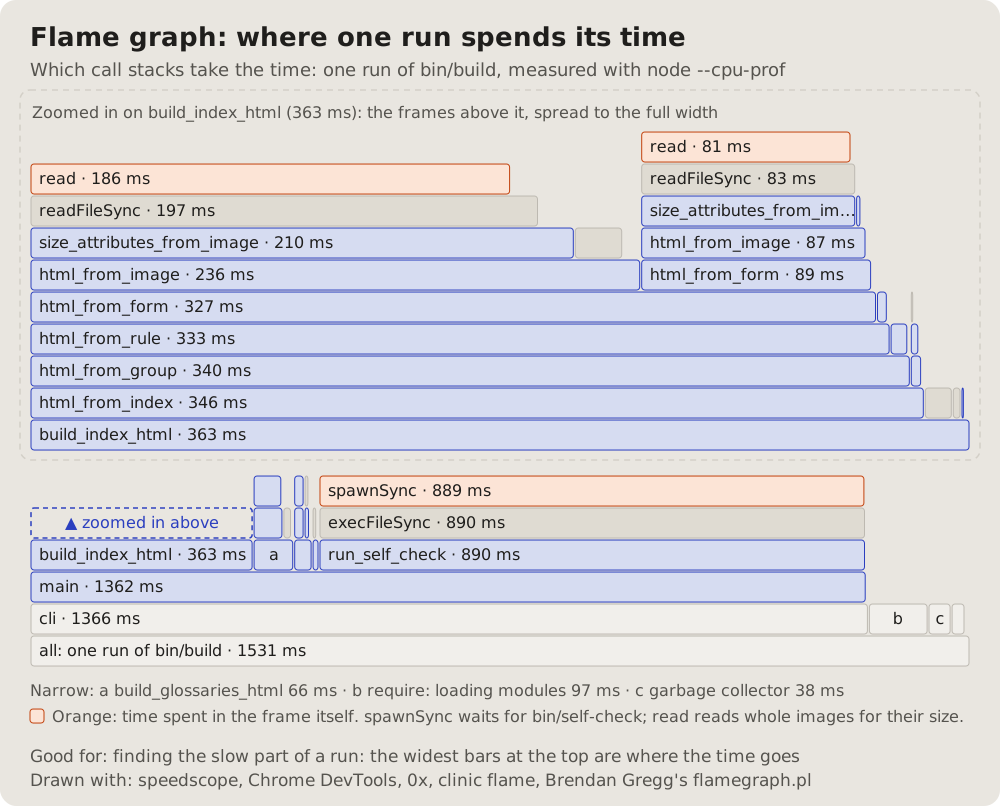
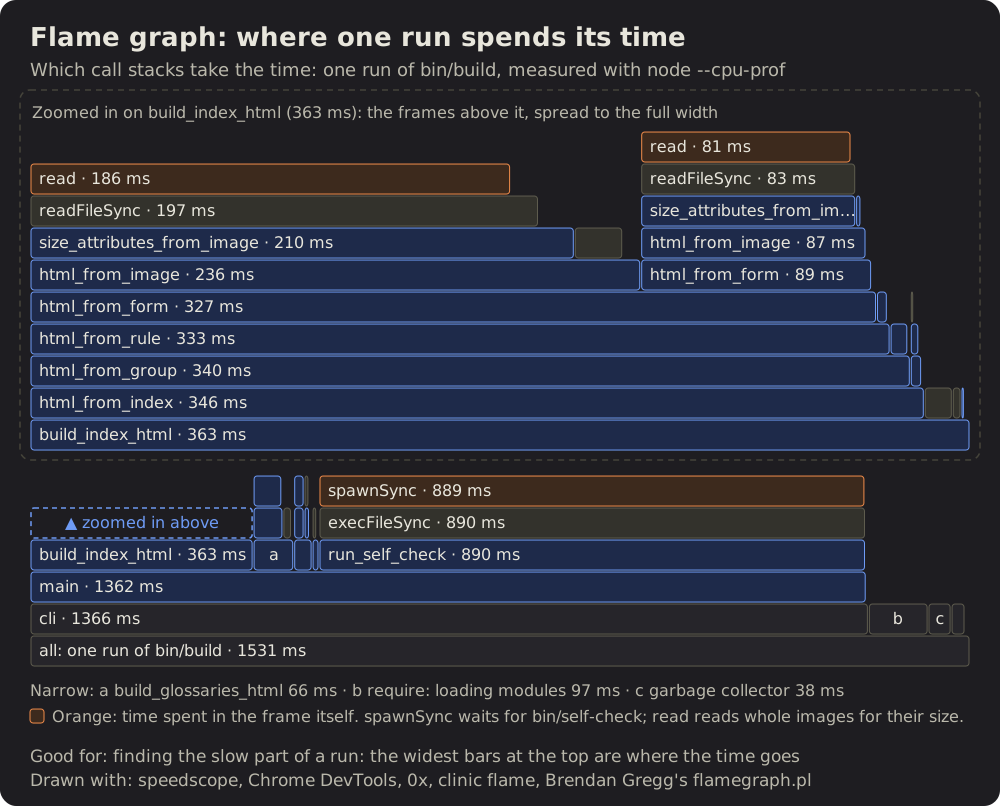 Flame graph
43 Flame graph: where one run spends its time
One measured run: each call stack a column of bars, the caller under the callee, each bar as wide as its share of the time.
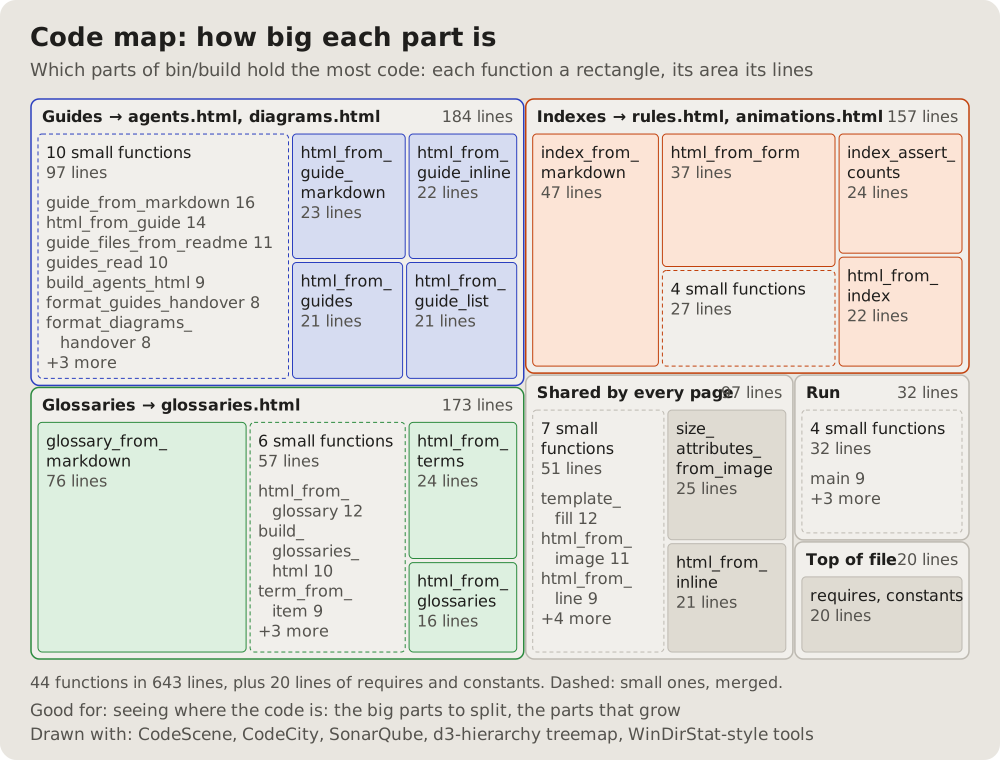
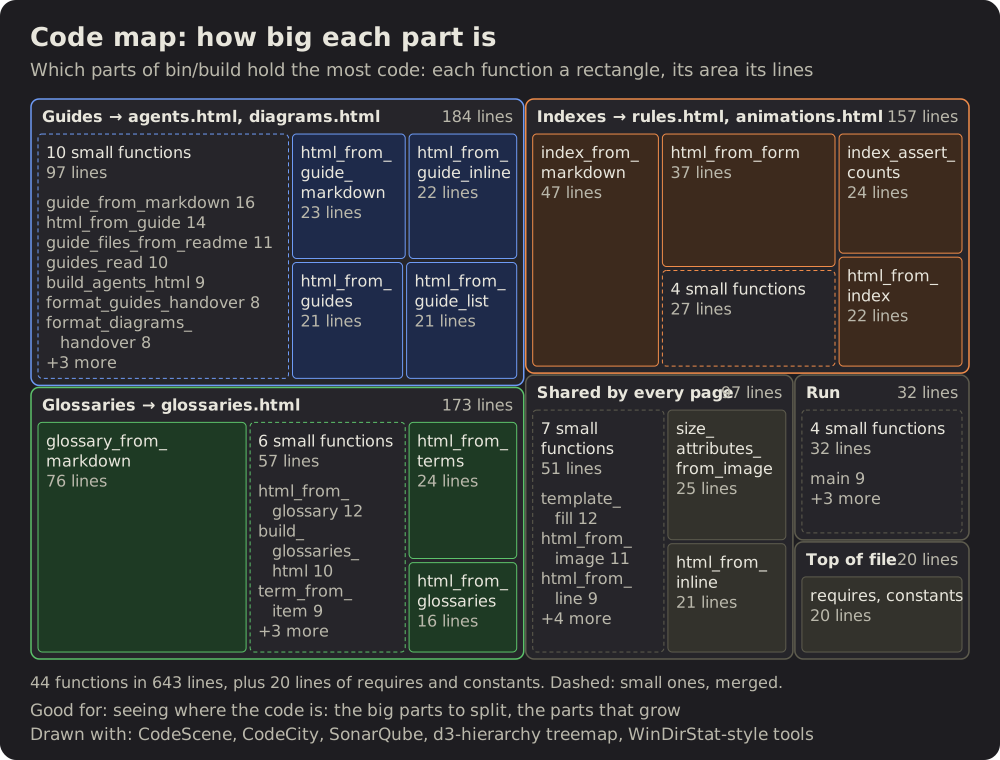 Code map
44 Code map: how big each part is
A treemap of the code: each function a rectangle, its area its lines, grouped by the part of the program it belongs to.
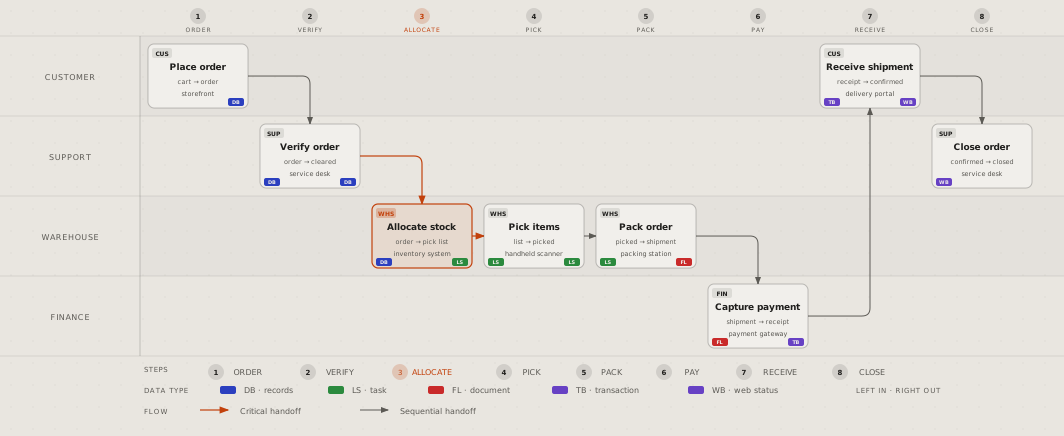
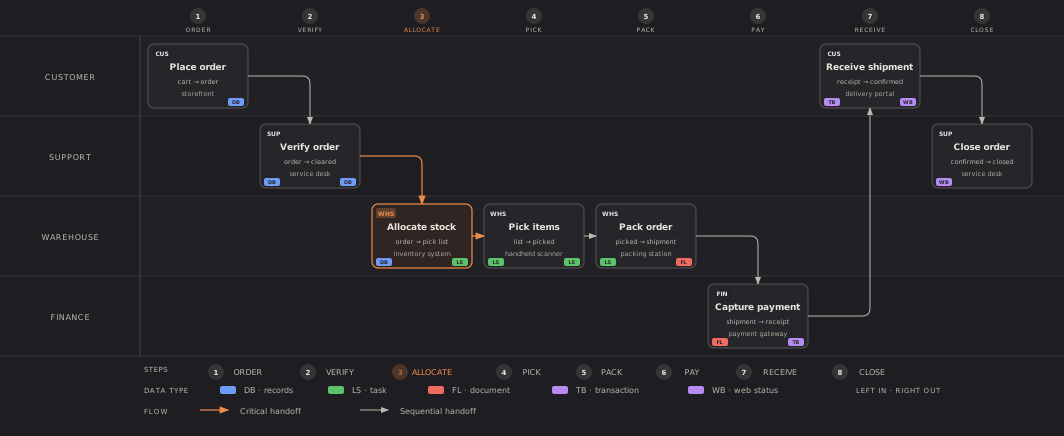 Diagram Design
45 Diagram Design: 25 kinds this page has no guide for
diagram-design is an agent skill that draws 50 kinds of diagram, each a page with one SVG written by hand.
USEHand them to an agent
Paste this into a project's CLAUDE.md or AGENTS.md: it is read at every start, so the agent draws its pictures this way without being told. The agents' guides hand these over too. To give one kind in a conversation, copy it with its Copy for an agent button.
01Sequence diagram: who talks to whom
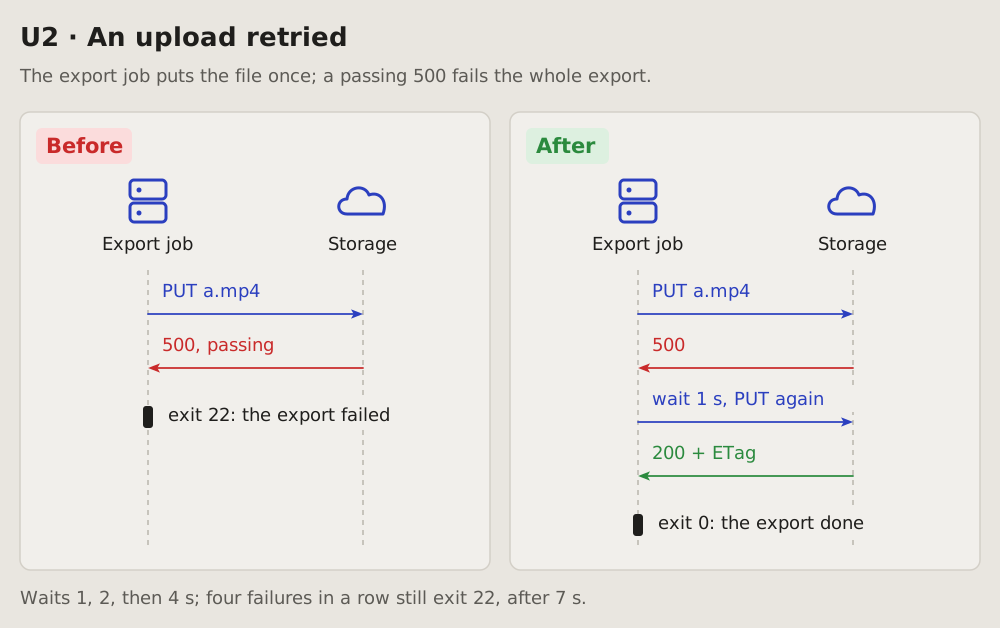
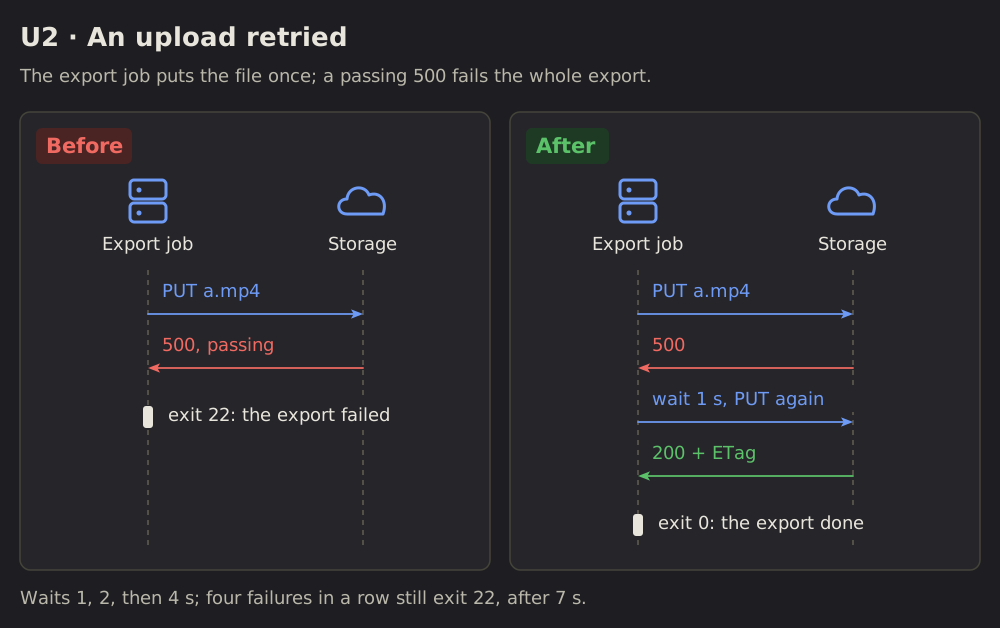
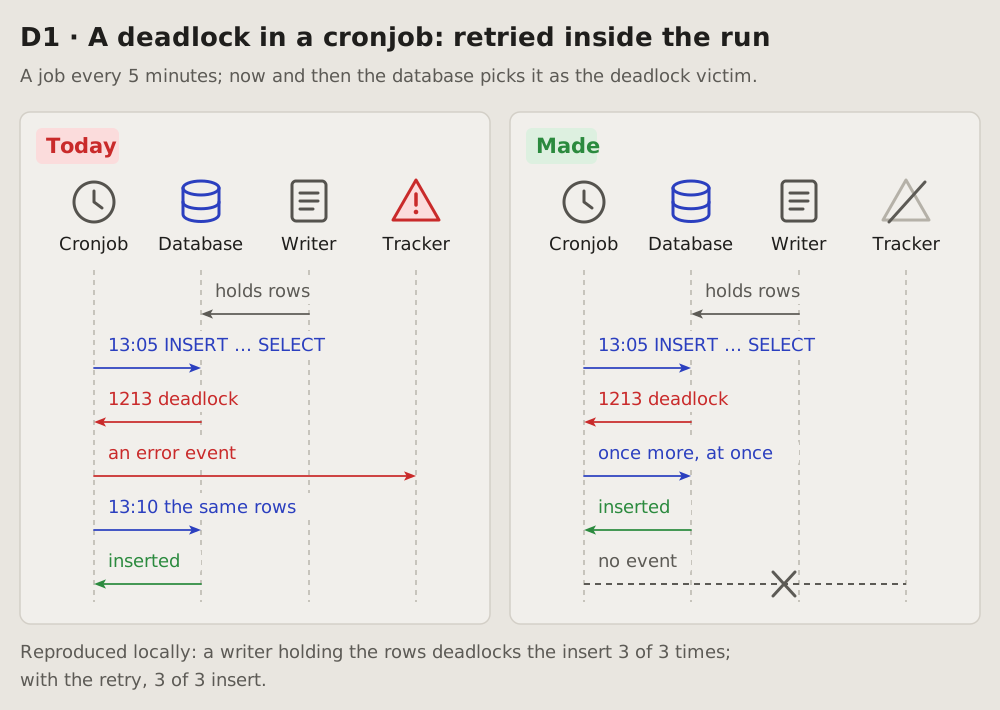
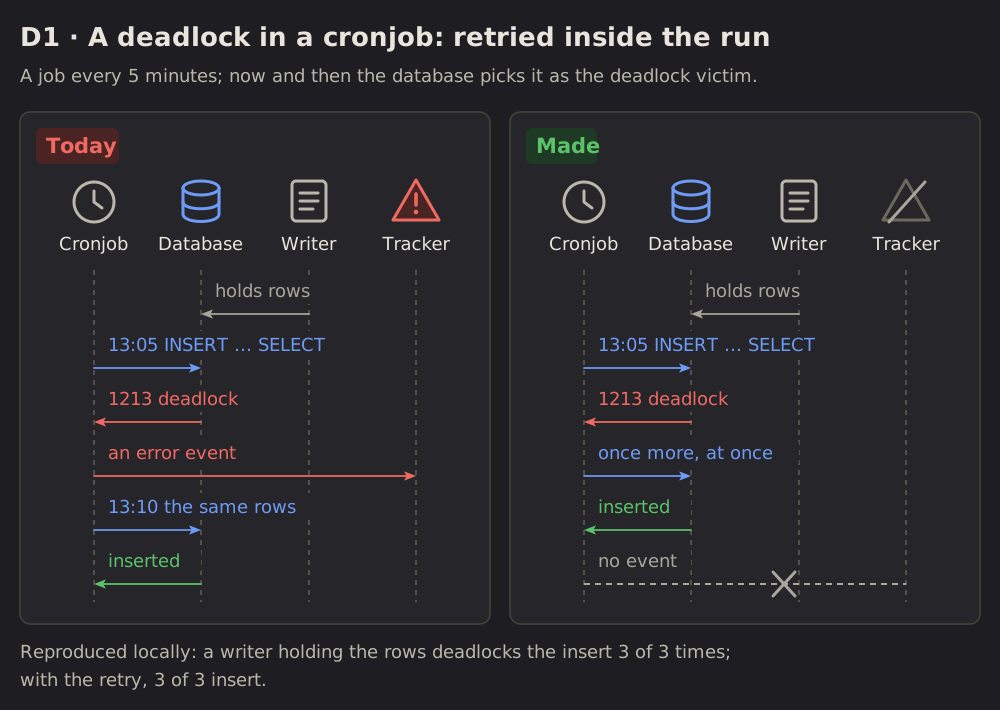
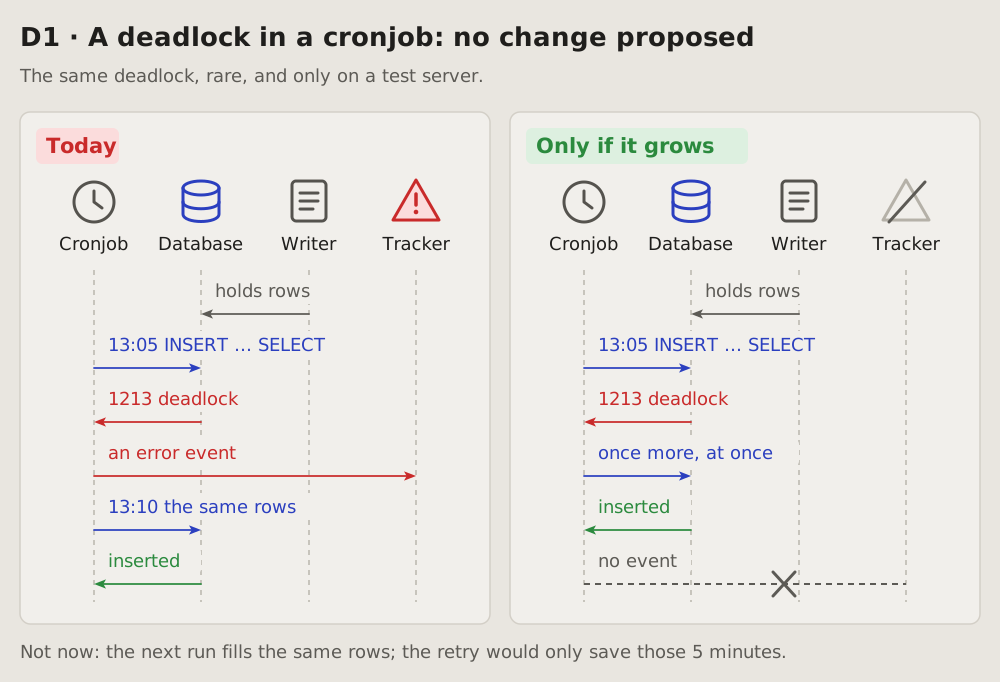
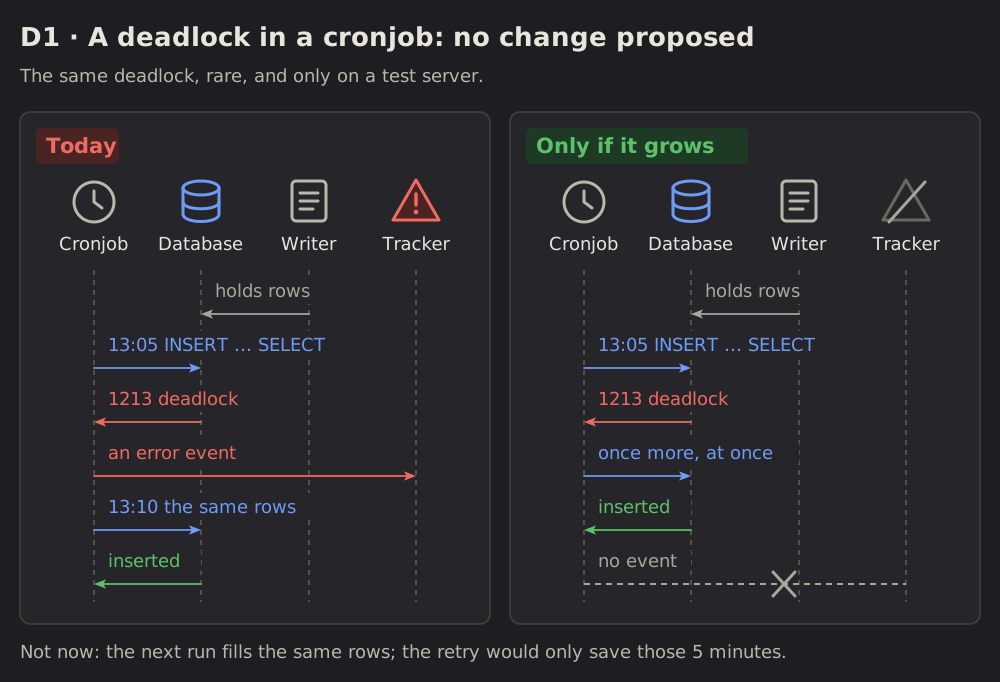
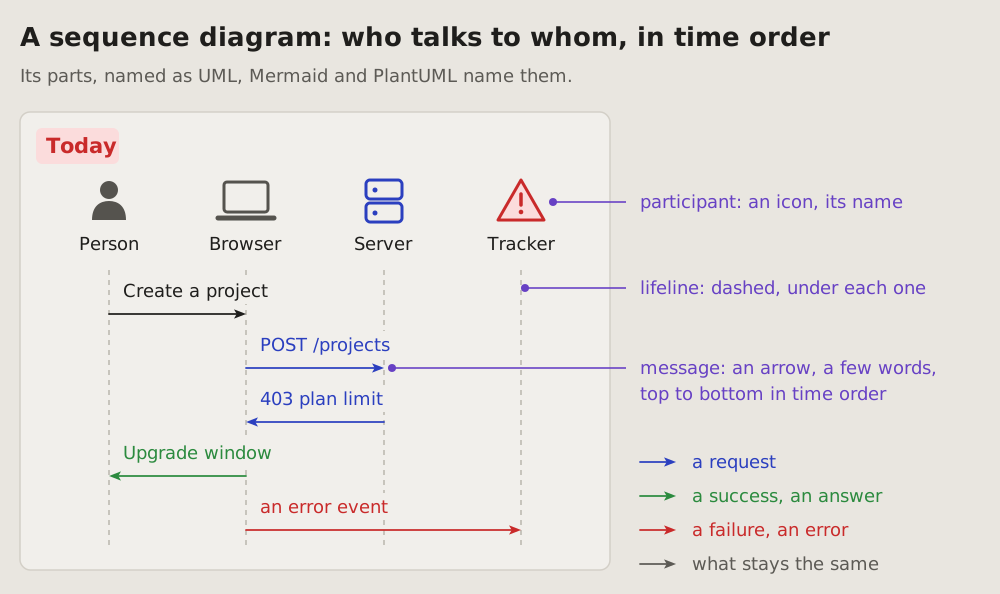
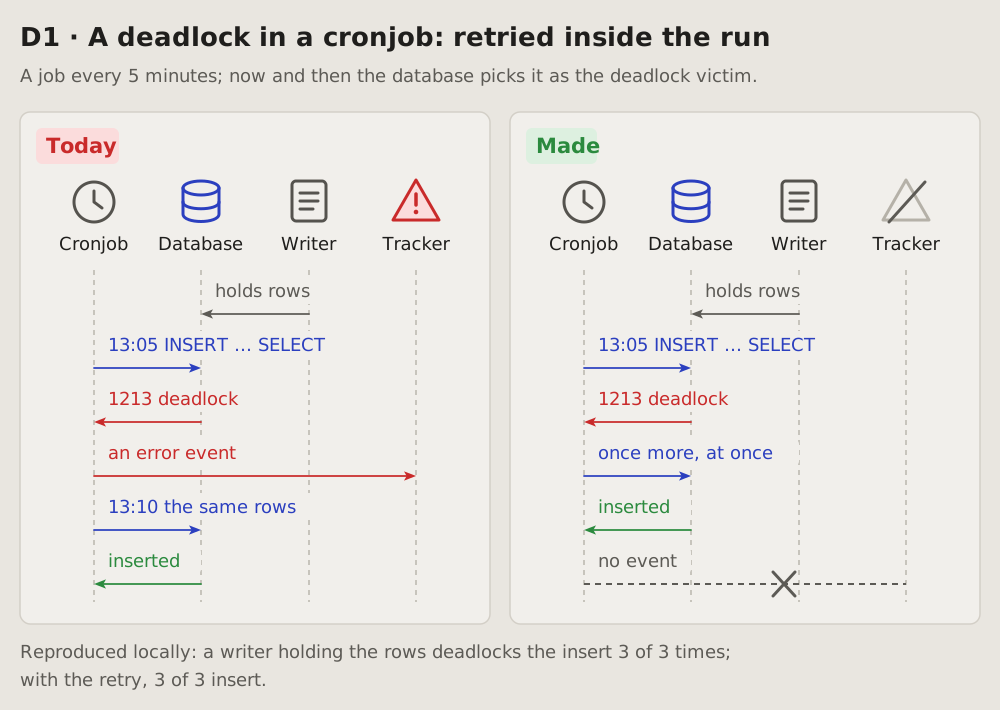
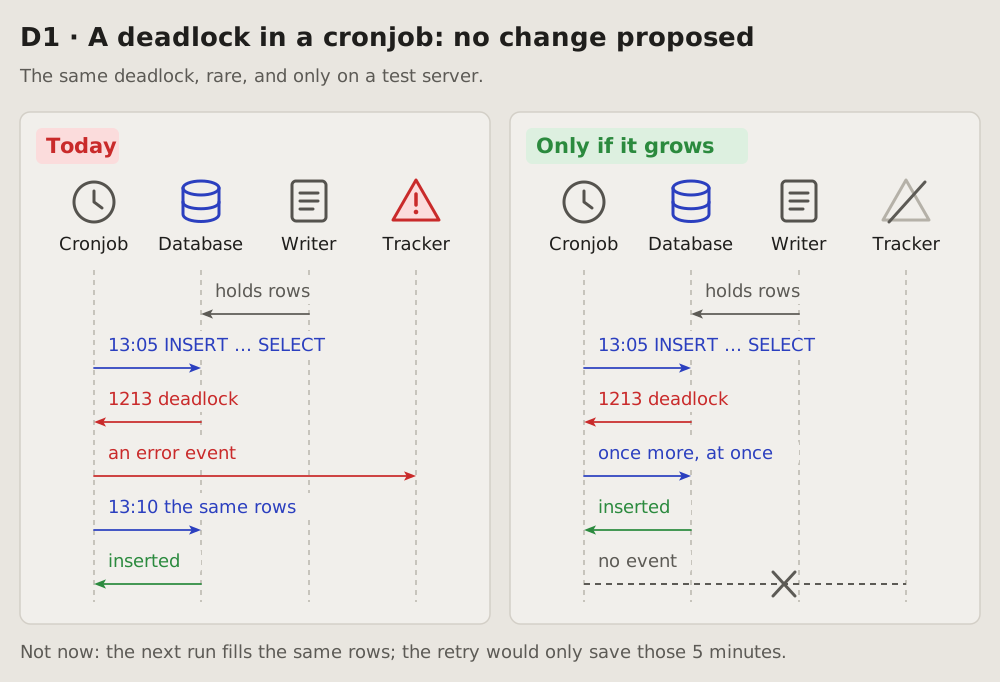
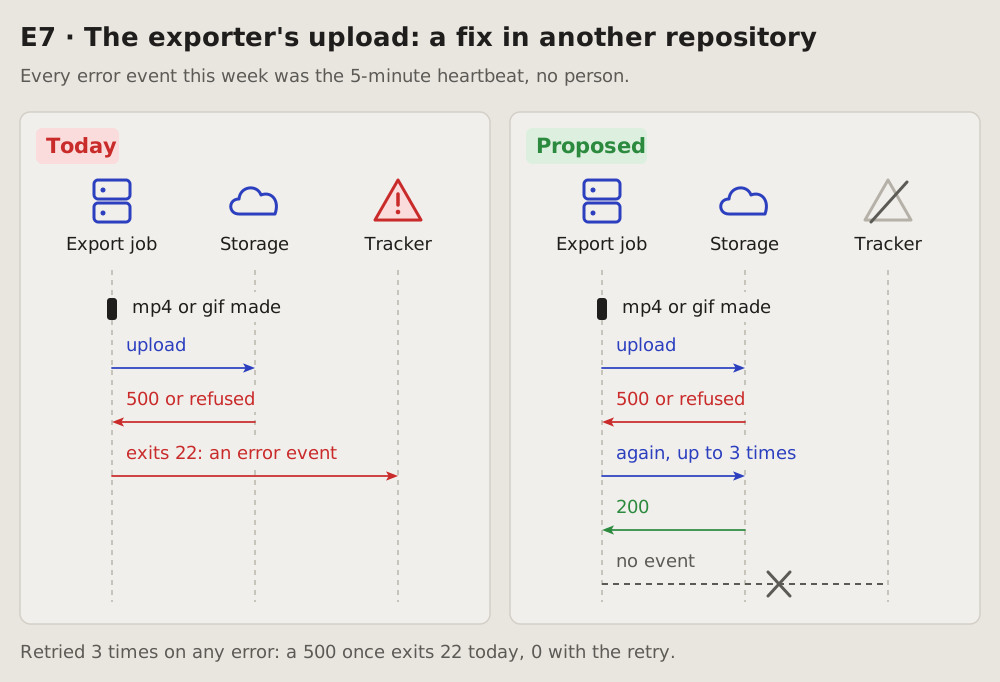
The course of events: the parts of a system as columns, what they send each other as arrows, top to bottom in time order. A request, a failure, a retry or a fix reads in one look, and today beside proposed shows only the change.
Fits when
- Parts pass something along: a person, a browser, a server, a database, a job, an outside service.
- The order matters: a failure, a retry, a timeout, a race; what happens where, and after what.
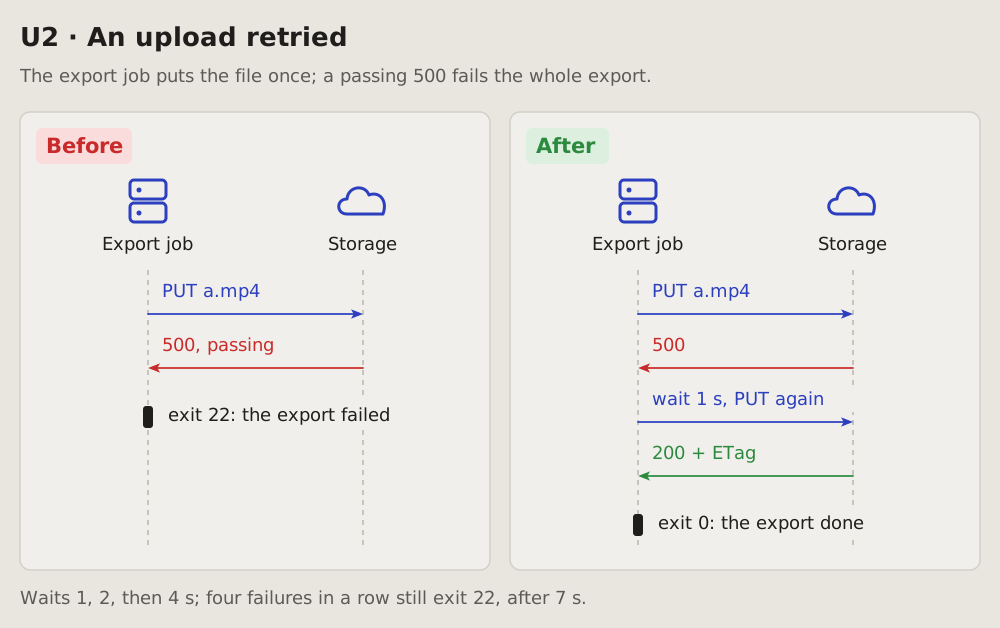
- A fix changes the course: a step added, an event dropped, a call moved. Today beside proposed.
Not when
- One part alone, nothing passed between: its states are a state diagram, its decisions a flowchart, its look a screenshot.
- The order does not matter, only where the parts run or how the data links: a container sketch or an entity-relationship diagram.
- The times matter more than who: a timeline.
- Too many at once: more than five participants or ten messages. Split it in two, or say it in a table.
- A change the author sees on screen: screenshots before and after say it better.
How it is drawn
- Participants: one column each, a plain icon above a short name. A person, a laptop or browser, a server, a database cylinder, a clock for a cronjob, a page for another writer or a file, a cloud for an outside service, a warning triangle for an error tracker. The icons carry most of the reading; the names stay short.
- Lifelines: a dashed vertical line under each participant.
- Messages: arrows between lifelines, top to bottom in time order, each with a few words. A request blue, a failure or an error red, a success or an answer green, what stays the same grey. A note on a step sits on its arrow:
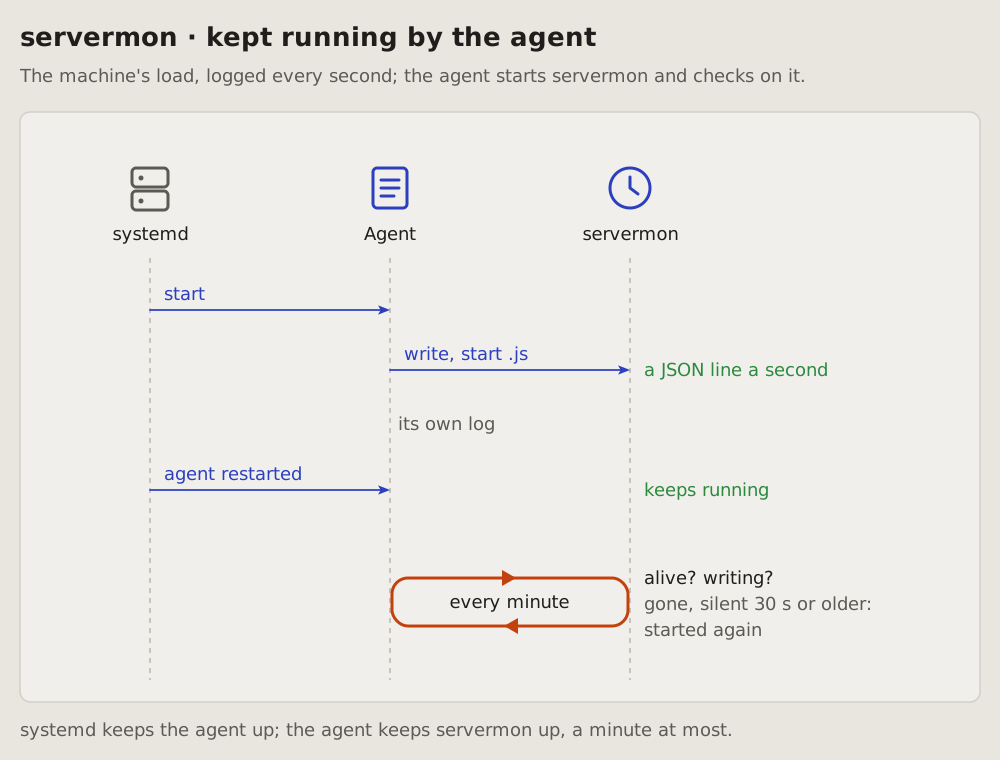
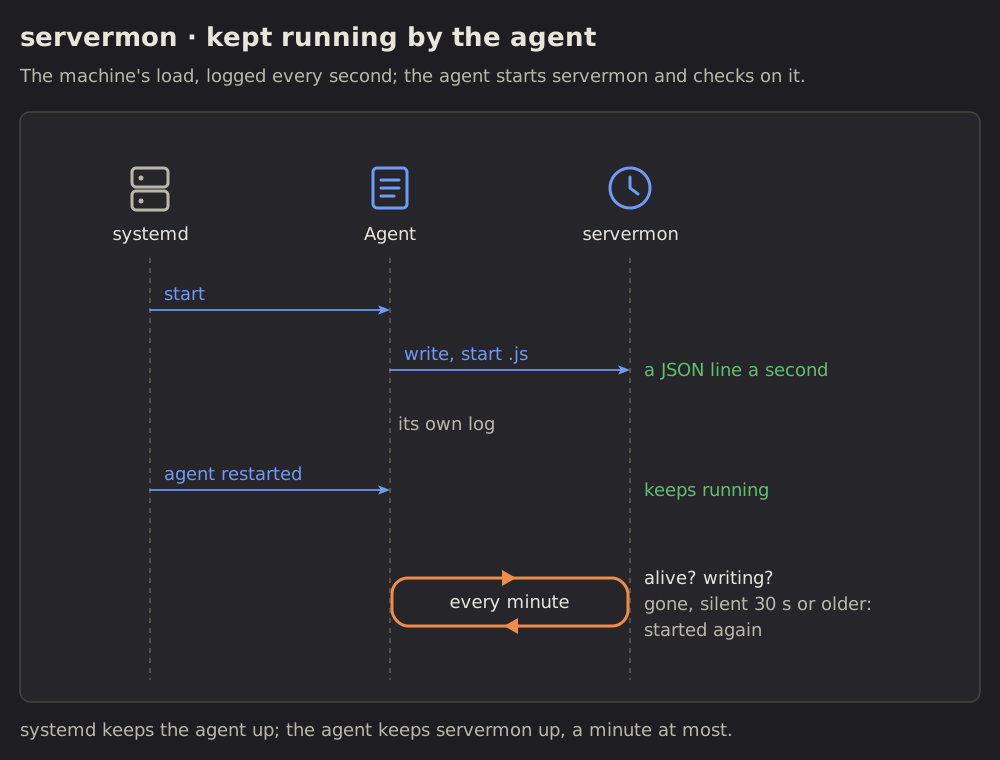
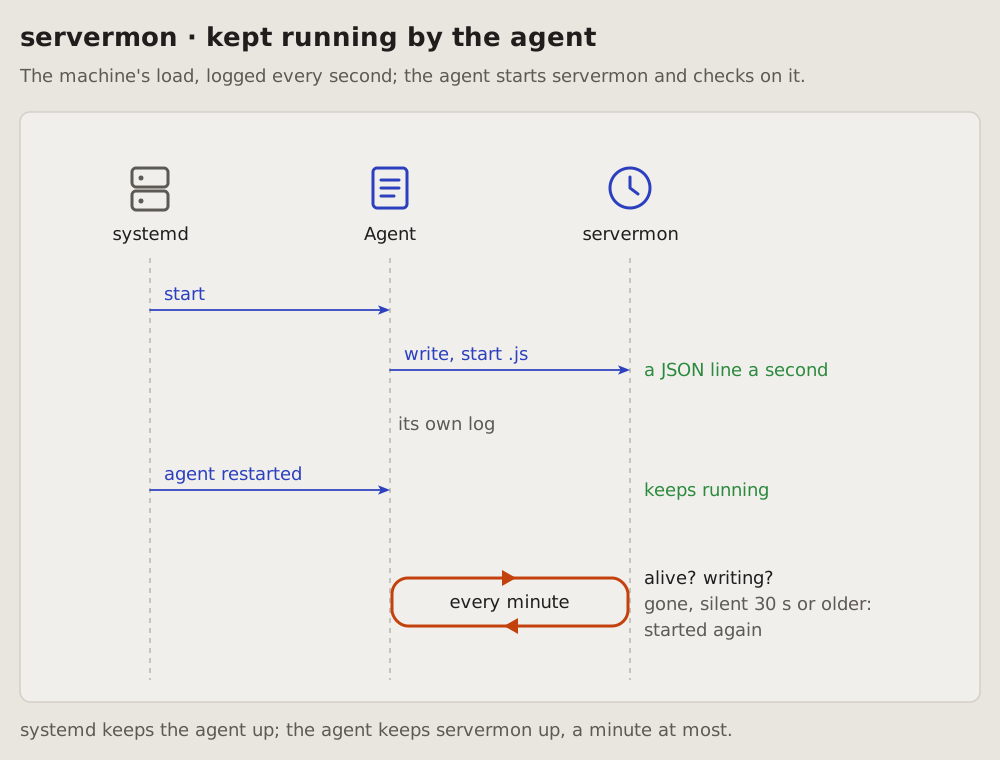
13:05 INSERT … SELECT, 403 plan limit. - A step on a clock or a loop (every minute, a retry until it works): a low rectangle with well-rounded corners (48 high for 18-pixel words, its radius a third of that), spanning the lifelines it involves. One arrowhead sits on its top edge pointing right, one on its bottom edge pointing left, so it reads as a cycle. Its period is written inside (
every minute); what it checks and does goes beside it, right of the lifelines: alive? writing?, then gone, silent 30 s or older: started again. The loop is orange, the waiting colour; its words keep the usual text colours.
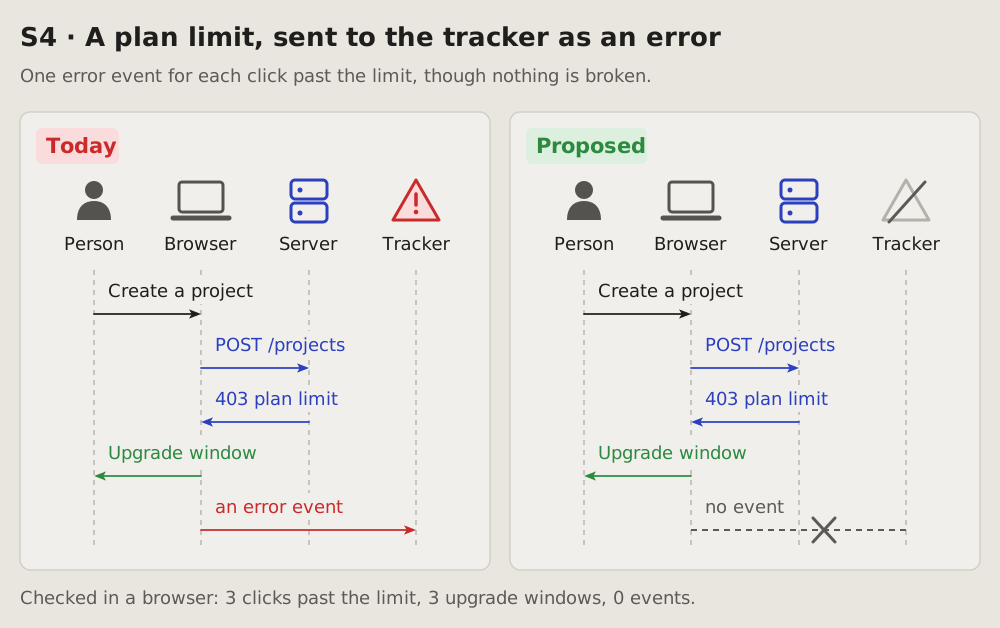
Turned down: a straight arrow reads as one call, not a repeat; an ellipse reads poorly; a UML loop frame around the steps, its tag in the corner, stretches a compact diagram into a long one. A refresh sign, a filled rectangle with an arrow on every side and a path out of a lifeline and back came second. 5. Today beside proposed (or before beside after, today beside made): two framed panels, tagged, the same participants in the same order, so only the change differs. The change is drawn, not described: an event crossed out, a step added, a participant greyed. 6. Around it: a title line with the item's id and what it is, one line of context under it (where, how often), one line of proof under the panels. 7. In the app's colours, and drawn for the width it is shown at: its words no smaller than the text around it.
Examples
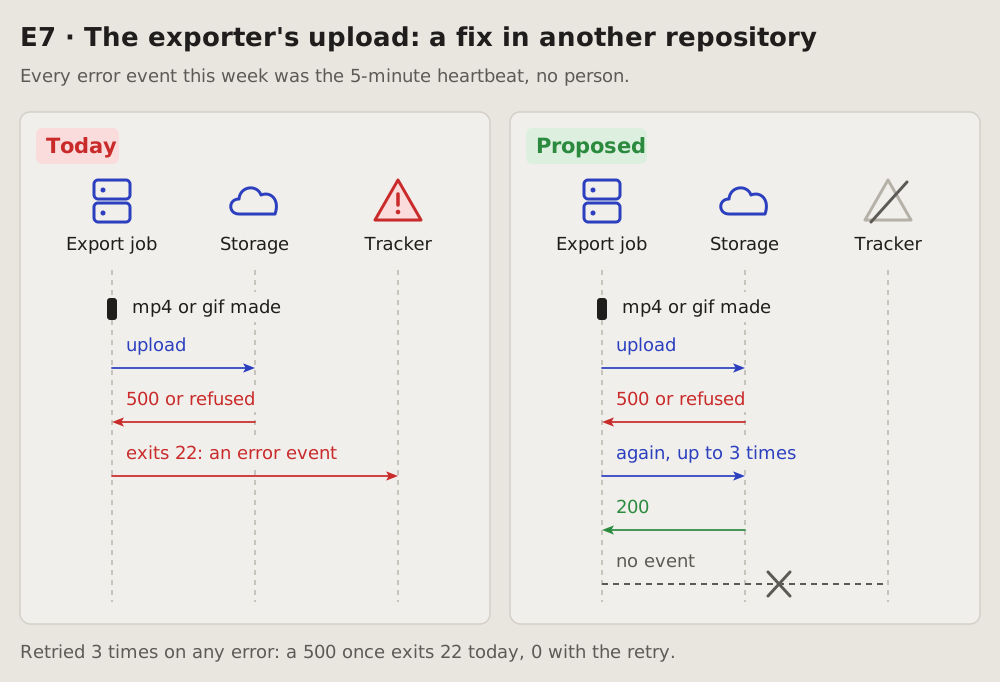
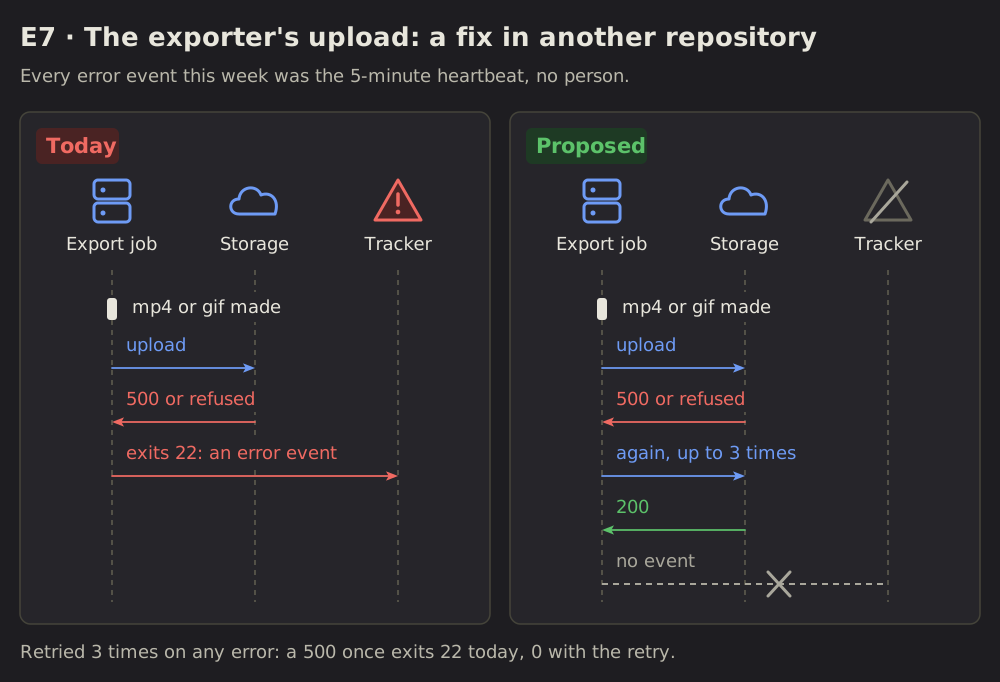
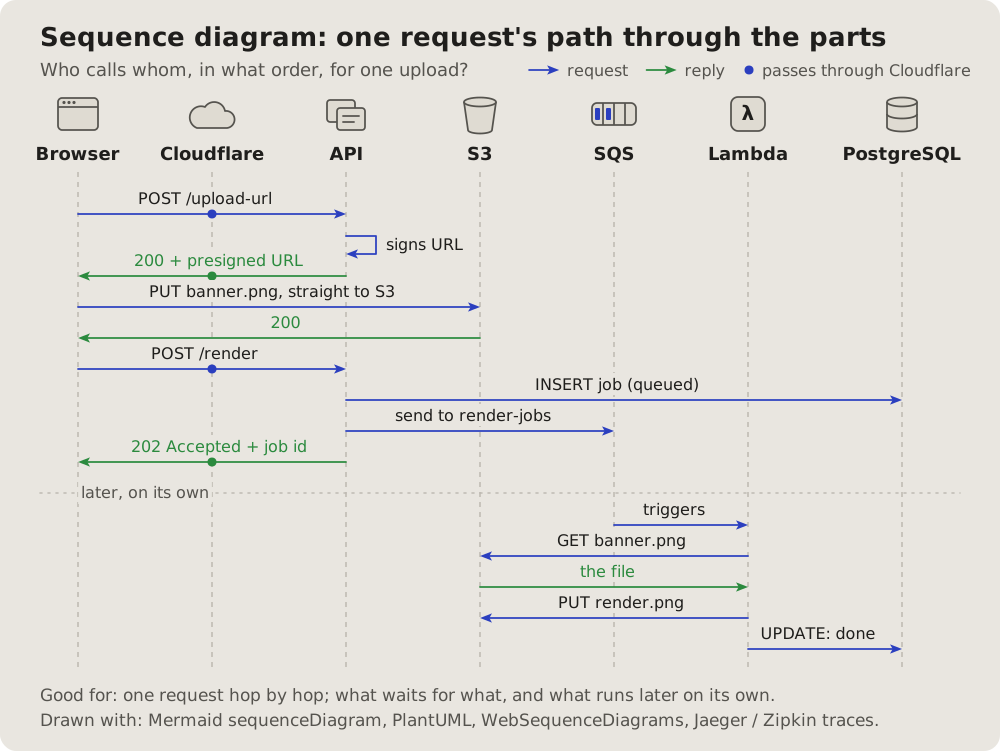
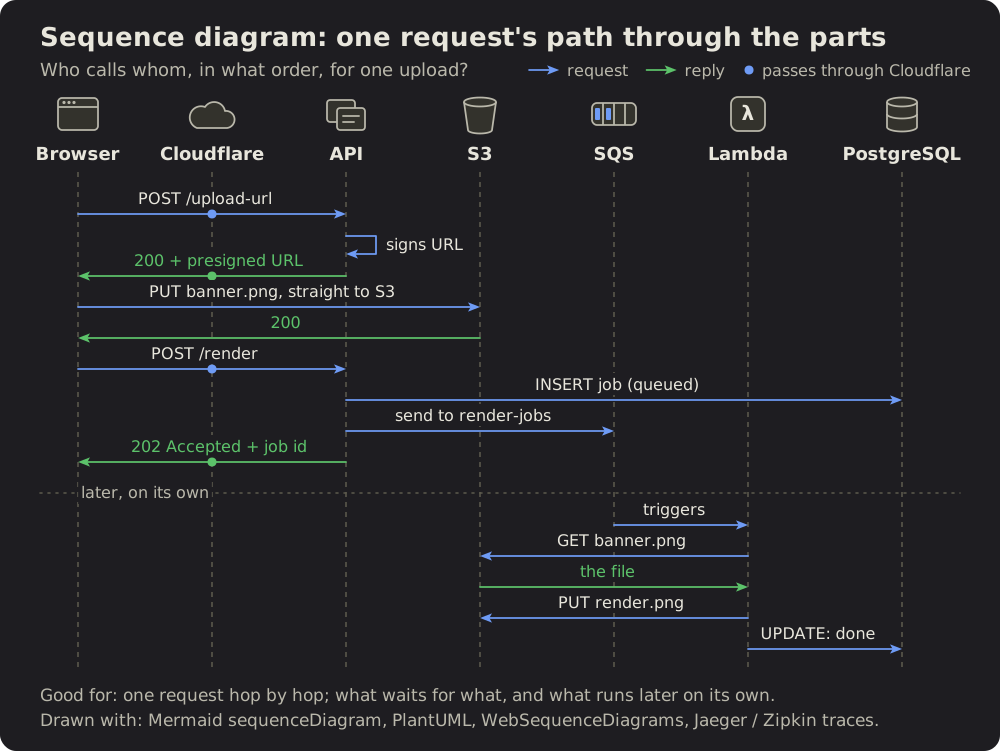
# Sequence diagram: who talks to whom
The course of events: the parts of a system as columns, what they send each
other as arrows, top to bottom in time order. A request, a failure, a retry or
a fix reads in one look, and today beside proposed shows only the change.
## Fits when
- **Parts pass something along:** a person, a browser, a server, a database,
a job, an outside service.
- **The order matters:** a failure, a retry, a timeout, a race; what happens
where, and after what.
- **A fix changes the course:** a step added, an event dropped, a call moved.
Today beside proposed.
## Not when
- **One part alone,** nothing passed between: its states are a
[state diagram](https://github.com/vbarbarosh/rules/blob/main/diagrams/state.md), its decisions a [flowchart](https://github.com/vbarbarosh/rules/blob/main/diagrams/flowchart.md), its
look a screenshot.
- **The order does not matter,** only where the parts run or how the data
links: a [container sketch](https://github.com/vbarbarosh/rules/blob/main/diagrams/containers.md) or an
[entity-relationship diagram](https://github.com/vbarbarosh/rules/blob/main/diagrams/entities.md).
- **The times matter more than who:** a [timeline](https://github.com/vbarbarosh/rules/blob/main/diagrams/timeline.md).
- **Too many at once:** more than five participants or ten messages. Split
it in two, or say it in a table.
- **A change the author sees on screen:** screenshots before and after say it
better.
## How it is drawn
1. **Participants:** one column each, a plain icon above a short name. A
person, a laptop or browser, a server, a database cylinder, a clock for a
cronjob, a page for another writer or a file, a cloud for an outside
service, a warning triangle for an error tracker. The icons carry most of
the reading; the names stay short.
2. **Lifelines:** a dashed vertical line under each participant.
3. **Messages:** arrows between lifelines, top to bottom in time order, each
with a few words. A request blue, a failure or an error red, a success or
an answer green, what stays the same grey. A note on a step sits on its
arrow: `13:05 INSERT … SELECT`, `403 plan limit`.
4. **A step on a clock or a loop** (every minute, a retry until it works):
a low rectangle with well-rounded corners (48 high for 18-pixel words,
its radius a third of that), spanning the lifelines it involves. One arrowhead sits on its top
edge pointing right, one on its bottom edge pointing left, so it reads as
a cycle. Its period is written inside (`every minute`); what it checks and
does goes beside it, right of the lifelines: `alive? writing?`, then
`gone, silent 30 s or older: started again`. The loop is orange, the
waiting colour; its words keep the usual text colours.
Turned down: a straight arrow reads as one call, not a repeat; an ellipse
reads poorly; a UML `loop` frame around the steps, its tag in the corner,
stretches a compact diagram into a long one. A refresh sign, a filled
rectangle with an arrow on every side and a path out of a lifeline and
back came second.
5. **Today beside proposed** (or before beside after, today beside made): two
framed panels, tagged, the same participants in the same order, so only
the change differs. The change is drawn, not described: an event crossed
out, a step added, a participant greyed.
6. **Around it:** a title line with the item's id and what it is, one line of
context under it (where, how often), one line of proof under the panels.
7. **In the app's colours,** and drawn for the width it is shown at: its words
no smaller than the text around it.
## Examples
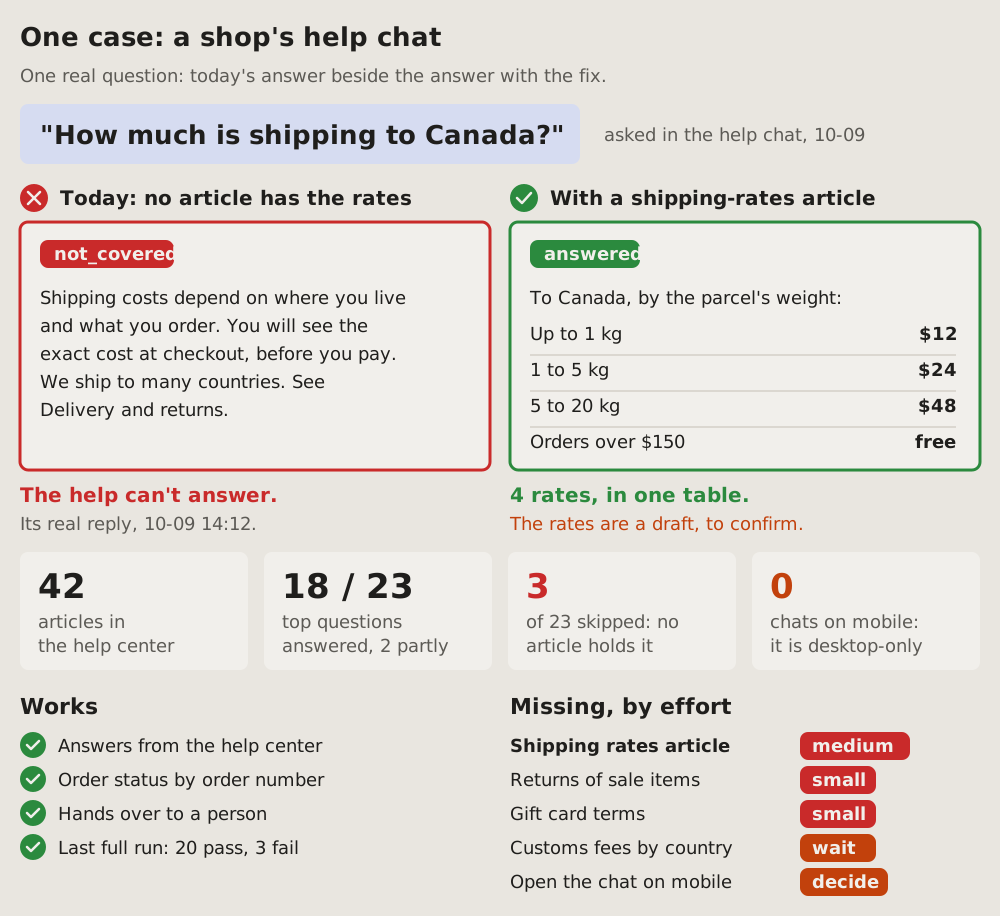
02One case: today beside fixed
One real request, its answer today beside its answer with the fix: the question on top, two framed panels under it, red for today and green for the fix. Big numbers and what works and what is missing follow, so the one case stands for the rest.
Fits when
- One real request shows the gap: a question a help chat cannot answer, a call that fails, a search that finds nothing.
- The fix is content or data, and its effect is the answer itself: a table, a value, a reply.
- The author must decide what to do next: the case convinces, the lists say what else is open and what each costs.
Not when
- The course of messages between parts changes, not the answer: a sequence diagram, today beside proposed.
- Many parts at once, each with its state: a status dashboard.
- A change on screen: two screenshots, before and after.
How it is drawn
- The question: quoted big in a soft blue box, where it was asked and when in grey beside it. The real words, not a summary.
- Today: a red frame, a red cross in a circle and "Today:" with why it fails; inside, the real answer as given and a red tag ("not_covered").
- With the fix: a green frame, a green tick and "With" and the fix; inside, the answer it would give and a green tag ("answered"). Values go in a small table, a line between rows.
- A verdict under each: in bold, red or green, what the panel shows; a line under it says where the real answer was seen, or in amber what is still to confirm.
- KPI cards: four big numbers for the whole, each a few words of what it counts; red or amber for a count that stands for a gap.
- Two lists: "Works" with green ticks; "Missing, by effort" with a pill per item, red for work to do (small, medium), amber for what waits on an answer (wait, check, decide). The item the case is about first, in bold.
- Ticks and crosses are drawn as paths, not typed as glyphs, so every font shows them alike.
# One case: today beside fixed
One real request, its answer today beside its answer with the fix: the
question on top, two framed panels under it, red for today and green for
the fix. Big numbers and what works and what is missing follow, so the one
case stands for the rest.
## Fits when
- **One real request shows the gap:** a question a help chat cannot
answer, a call that fails, a search that finds nothing.
- **The fix is content or data,** and its effect is the answer itself: a
table, a value, a reply.
- **The author must decide what to do next:** the case convinces, the
lists say what else is open and what each costs.
## Not when
- **The course of messages between parts** changes, not the answer: a
[sequence diagram](https://github.com/vbarbarosh/rules/blob/main/diagrams/sequence.md), today beside proposed.
- **Many parts at once,** each with its state: a
[status dashboard](https://github.com/vbarbarosh/rules/blob/main/diagrams/dashboard.md).
- **A change on screen:** two screenshots, before and after.
## How it is drawn
1. **The question:** quoted big in a soft blue box, where it was asked and
when in grey beside it. The real words, not a summary.
2. **Today:** a red frame, a red cross in a circle and "Today:" with why it
fails; inside, the real answer as given and a red tag ("not_covered").
3. **With the fix:** a green frame, a green tick and "With" and the fix;
inside, the answer it would give and a green tag ("answered"). Values
go in a small table, a line between rows.
4. **A verdict under each:** in bold, red or green, what the panel shows;
a line under it says where the real answer was seen, or in amber what
is still to confirm.
5. **KPI cards:** four big numbers for the whole, each a few words of what
it counts; red or amber for a count that stands for a gap.
6. **Two lists:** "Works" with green ticks; "Missing, by effort" with a
pill per item, red for work to do (small, medium), amber for what waits
on an answer (wait, check, decide). The item the case is about first,
in bold.
7. **Ticks and crosses** are drawn as paths, not typed as glyphs, so every
font shows them alike.
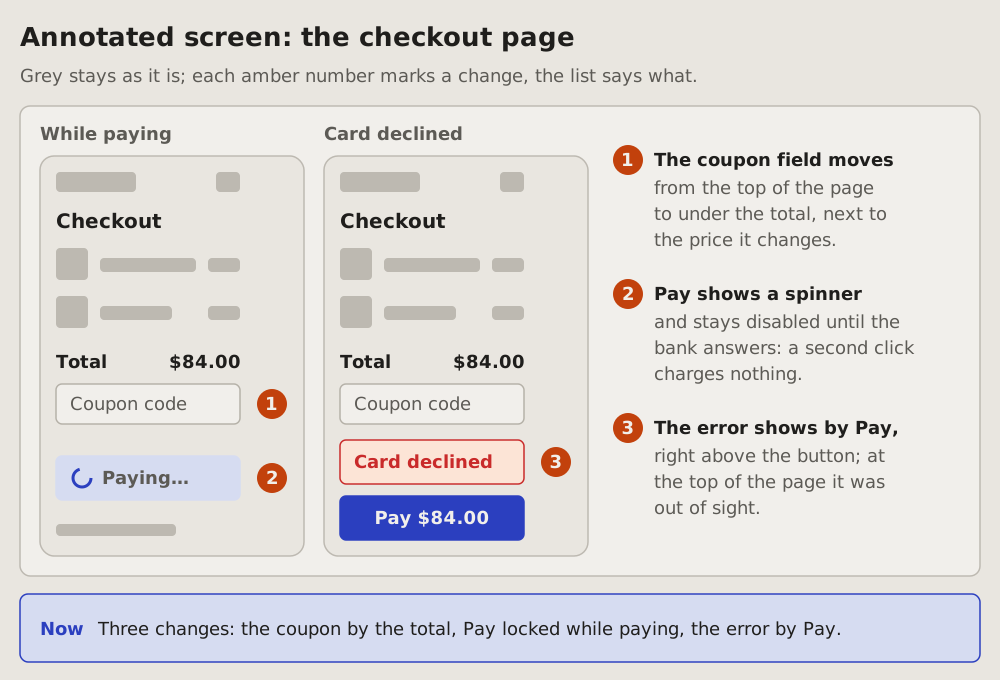
03Annotated screen: where on the screen
A plain sketch of a screen, grey blocks and a few real labels, with an amber number on each spot that changes; beside it a numbered list says what changes at each. The reader sees where the change is before reading what it is.
Fits when
- A change to a screen: a field moves, a button gets a new state, a message shows in a new place.
- The question is where: words alone would say "the error moves up" and leave the reader to guess from where to where.
- No screenshots yet: the change is planned, or the screen is still being built.
Not when
- Real screenshots exist before and after: one case, the screenshots side by side.
- The parts of a system, not of a screen: a container diagram.
- A thing's states and what moves it between them: a state diagram.
How it is drawn
- The sketch: the screen as a framed wireframe, its parts as plain grey blocks; only the parts that matter get real labels, such as the total, a field's placeholder or a button's text.
- States: a frame per state when the change shows in one state only, such as while paying or after an error; the state's name in bold above its frame. One frame when the state does not matter.
- The numbers: an amber circle with a number beside each spot that changes, in the margin of the frame, never over a label; each number once only, in the frame where it shows best.
- Colour in the sketch: grey for what stays; the changed parts in their real colours, such as a blue button or a red error.
- The list: beside the sketch, the same amber numbers in order, each with what changes in bold and a line or two of why under it.
- Now: a blue box under the panel says in one sentence all the changes together.
# Annotated screen: where on the screen
A plain sketch of a screen, grey blocks and a few real labels, with an
amber number on each spot that changes; beside it a numbered list says
what changes at each. The reader sees where the change is before reading
what it is.
## Fits when
- **A change to a screen:** a field moves, a button gets a new state, a
message shows in a new place.
- **The question is where:** words alone would say "the error moves up"
and leave the reader to guess from where to where.
- **No screenshots yet:** the change is planned, or the screen is still
being built.
## Not when
- **Real screenshots exist** before and after: [one case](https://github.com/vbarbarosh/rules/blob/main/diagrams/case.md), the
screenshots side by side.
- **The parts of a system,** not of a screen: a
[container diagram](https://github.com/vbarbarosh/rules/blob/main/diagrams/containers.md).
- **A thing's states** and what moves it between them: a
[state diagram](https://github.com/vbarbarosh/rules/blob/main/diagrams/state.md).
## How it is drawn
1. **The sketch:** the screen as a framed wireframe, its parts as plain
grey blocks; only the parts that matter get real labels, such as the
total, a field's placeholder or a button's text.
2. **States:** a frame per state when the change shows in one state
only, such as while paying or after an error; the state's name in
bold above its frame. One frame when the state does not matter.
3. **The numbers:** an amber circle with a number beside each spot that
changes, in the margin of the frame, never over a label; each number
once only, in the frame where it shows best.
4. **Colour in the sketch:** grey for what stays; the changed parts in
their real colours, such as a blue button or a red error.
5. **The list:** beside the sketch, the same amber numbers in order,
each with what changes in bold and a line or two of why under it.
6. **Now:** a blue box under the panel says in one sentence all the
changes together.
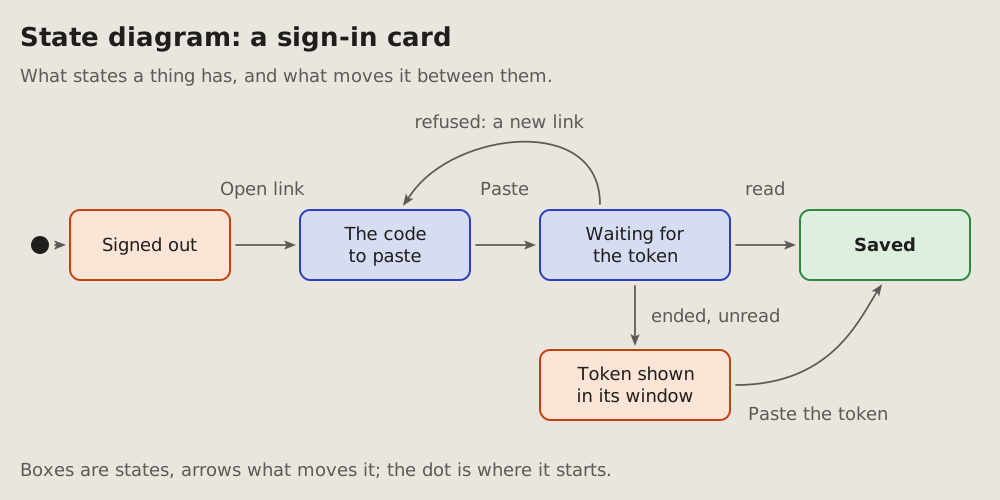
04State diagram: what moves a thing between its states
The states a thing has and what moves it from one to the next: a card's steps, a message's life, a job's run. Each state is a box; each arrow says what moves it.
Fits when
- A thing has a few states, and the question is how it gets from one to another, or why it stays in one.
- A state can be reached by more than one way, or left by a way that goes back.
- A bug is a wrong state: stuck, skipped, or reached from where it should not be.
Not when
- The order of calls between parts is the question: that is a sequence diagram.
- One decision with its answers, no lasting state: a flowchart.
- More than about eight states: draw the part that matters, and say the rest.
How it is drawn
- States: rounded boxes, a short name each. Coloured by what they mean: blue a step on the way, green the end that is wanted, orange one that needs a look.
- Transitions: the project's arrows, grey, each with the few words that move it (a click, an answer, a timeout).
- The start: a filled dot with an arrow into the first state.
- Around it: a title with the thing's name, one line of context, one line under it saying how to read it.
# State diagram: what moves a thing between its states
The states a thing has and what moves it from one to the next: a card's
steps, a message's life, a job's run. Each state is a box; each arrow says
what moves it.
## Fits when
- **A thing has a few states,** and the question is how it gets from one to
another, or why it stays in one.
- **A state can be reached by more than one way,** or left by a way that
goes back.
- **A bug is a wrong state:** stuck, skipped, or reached from where it
should not be.
## Not when
- **The order of calls between parts** is the question: that is a
[sequence diagram](https://github.com/vbarbarosh/rules/blob/main/diagrams/sequence.md).
- **One decision with its answers,** no lasting state: a
[flowchart](https://github.com/vbarbarosh/rules/blob/main/diagrams/flowchart.md).
- **More than about eight states:** draw the part that matters, and say the
rest.
## How it is drawn
1. **States:** rounded boxes, a short name each. Coloured by what they mean:
blue a step on the way, green the end that is wanted, orange one that
needs a look.
2. **Transitions:** the project's arrows, grey, each with the few words
that move it (a click, an answer, a timeout).
3. **The start:** a filled dot with an arrow into the first state.
4. **Around it:** a title with the thing's name, one line of context, one
line under it saying how to read it.
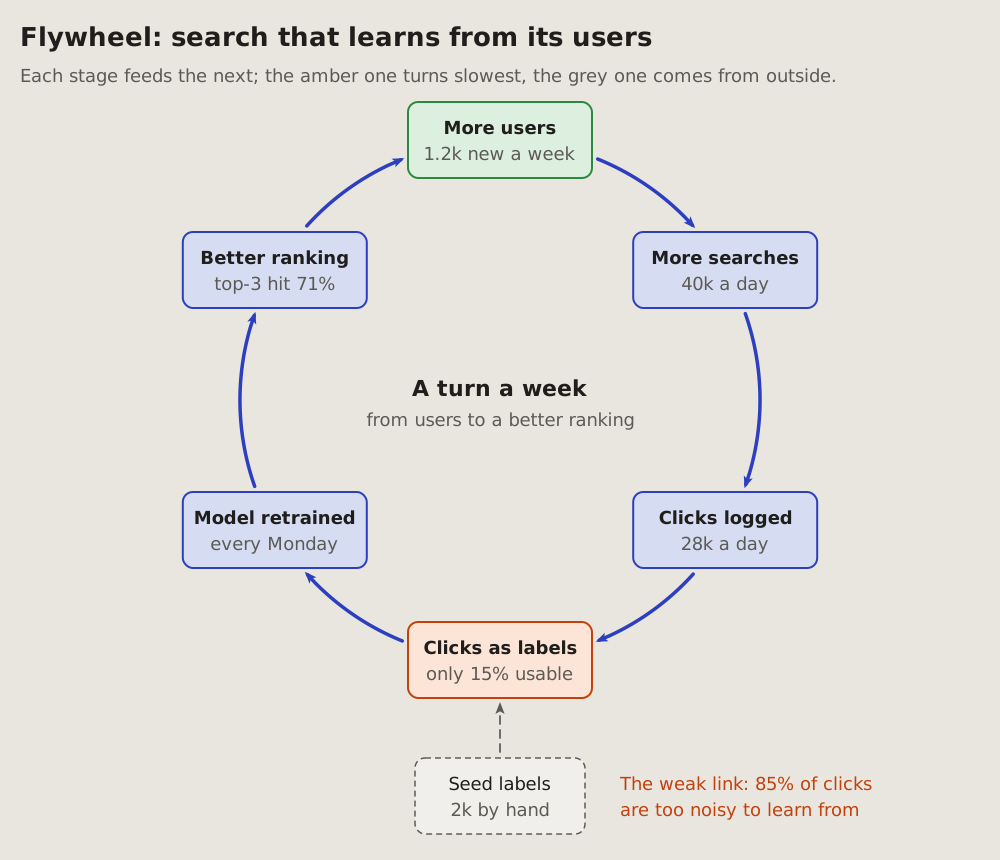
05Flywheel: what feeds itself
A loop that grows as it turns: each stage feeds the next, and the last feeds the first, so the next turn starts bigger. A data flywheel is the common case: use makes data, data makes a better model, a better model brings more use. Also called a virtuous cycle or a reinforcing loop.
Fits when
- Growth feeds itself: more users bring more data, more data a better product, a better product more users.
- The question is where it is slow: which stage holds back every turn after it.
- A start from outside: what was put in by hand to get it turning, seed data or a launch.
Not when
- A thing goes round its states, nothing grows: a state diagram.
- A step repeats on a clock (every minute, a retry): the loop on a sequence diagram.
- How much each stage moves on: a sankey, its bands as wide as their share.
How it is drawn
- Stages: four to six boxes evenly on one circle, clockwise, the outcome on top; each with its name and its number now (40k a day).
- Arrows: blue and bold, arcs of that same circle, each from one stage into the next; the last back into the first. Nothing bends off the circle: a wheel that wobbles reads as broken.
- The weak link: the stage that turns slowest in amber, said in a line under the ring.
- From outside: what started it or still feeds it, a grey dashed box with its arrow into the stage it feeds.
- The middle: how long one turn takes.
# Flywheel: what feeds itself
A loop that grows as it turns: each stage feeds the next, and the last
feeds the first, so the next turn starts bigger. A data flywheel is the
common case: use makes data, data makes a better model, a better model
brings more use. Also called a virtuous cycle or a reinforcing loop.
## Fits when
- **Growth feeds itself:** more users bring more data, more data a better
product, a better product more users.
- **The question is where it is slow:** which stage holds back every turn
after it.
- **A start from outside:** what was put in by hand to get it turning,
seed data or a launch.
## Not when
- **A thing goes round its states, nothing grows:** a
[state diagram](https://github.com/vbarbarosh/rules/blob/main/diagrams/state.md).
- **A step repeats on a clock** (every minute, a retry): the loop on a
[sequence diagram](https://github.com/vbarbarosh/rules/blob/main/diagrams/sequence.md).
- **How much each stage moves on:** a [sankey](https://github.com/vbarbarosh/rules/blob/main/diagrams/sankey.md), its bands as
wide as their share.
## How it is drawn
1. **Stages:** four to six boxes evenly on one circle, clockwise, the
outcome on top; each with its name and its number now (40k a day).
2. **Arrows:** blue and bold, arcs of that same circle, each from one
stage into the next; the last back into the first. Nothing bends off
the circle: a wheel that wobbles reads as broken.
3. **The weak link:** the stage that turns slowest in amber, said in a
line under the ring.
4. **From outside:** what started it or still feeds it, a grey dashed
box with its arrow into the stage it feeds.
5. **The middle:** how long one turn takes.
06Flowchart: what is decided where
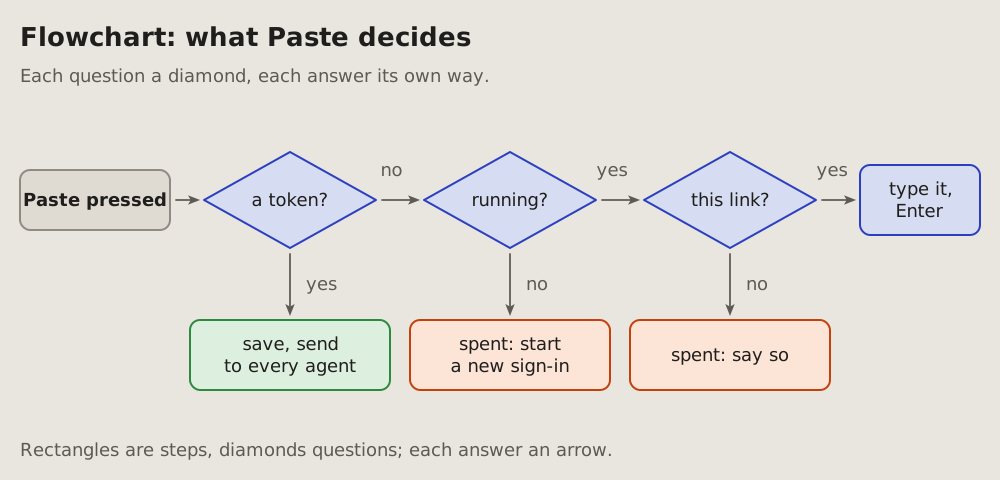
The decisions one action goes through, in order: each question a diamond, each answer its own arrow, each outcome a box.
Fits when
- One action branches: a click, a request or a job that does different things depending on what it finds.
- The question is which way it went, and why: an outcome nobody expected.
- A rule has cases, and every case must be seen at once.
Not when
- A thing lives through states and comes back to them: a state diagram.
- Several parts take turns: a sequence diagram.
- More than about six questions: split it, or say it as a table of cases.
How it is drawn
- Steps: rectangles; the one that starts it darker.
- Questions: diamonds, a few words ending in a question mark, the words inside the diamond.
- Answers: the project's arrows, one per answer, each labelled (yes, no, or the value).
- Outcomes: boxes coloured by what they mean: green done, orange refused or spent, blue the way on.
- Left to right for the main way, down for the answers that leave it.
# Flowchart: what is decided where
The decisions one action goes through, in order: each question a diamond,
each answer its own arrow, each outcome a box.
## Fits when
- **One action branches:** a click, a request or a job that does different
things depending on what it finds.
- **The question is which way it went,** and why: an outcome nobody
expected.
- **A rule has cases,** and every case must be seen at once.
## Not when
- **A thing lives through states** and comes back to them: a
[state diagram](https://github.com/vbarbarosh/rules/blob/main/diagrams/state.md).
- **Several parts take turns:** a [sequence diagram](https://github.com/vbarbarosh/rules/blob/main/diagrams/sequence.md).
- **More than about six questions:** split it, or say it as a table of
cases.
## How it is drawn
1. **Steps:** rectangles; the one that starts it darker.
2. **Questions:** diamonds, a few words ending in a question mark, the
words inside the diamond.
3. **Answers:** the project's arrows, one per answer, each labelled (yes,
no, or the value).
4. **Outcomes:** boxes coloured by what they mean: green done, orange
refused or spent, blue the way on.
5. **Left to right** for the main way, **down** for the answers that leave
it.
07Swimlanes: who does each step
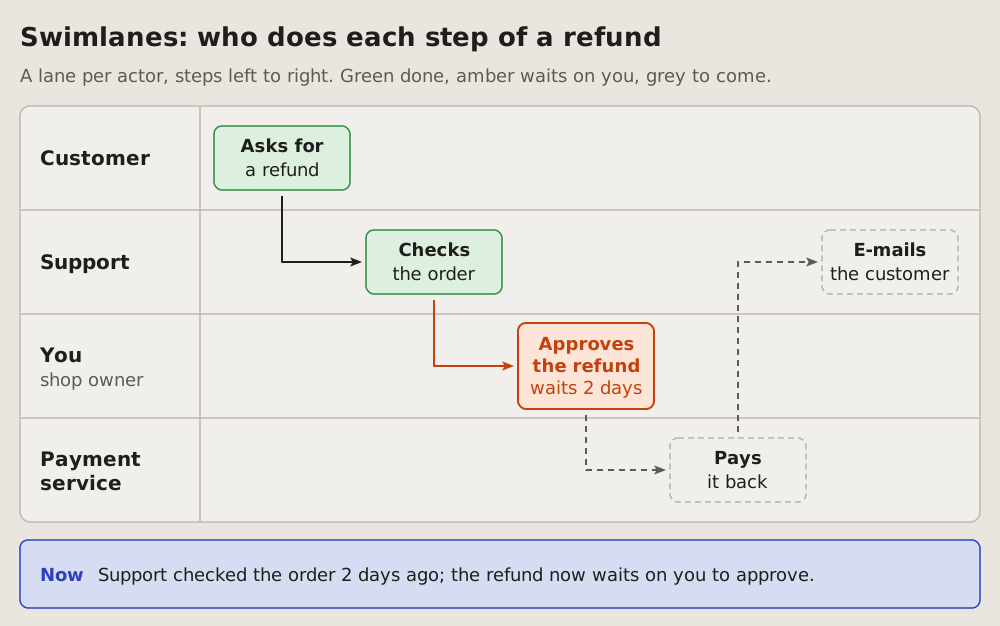
A process as its steps in order, a lane per actor, each step a box in the lane of who does it. An arrow leads from each step to the next, and it crosses lanes where the work changes hands. The reader sees who holds the work now and which hand-off waits on them.
Fits when
- Several people or services share one process, each doing a part of it in turn.
- The question is who does what, and where the work passes from one to another.
- A hand-off is slow or stuck, and the reader sees whose lane it waits in, often their own.
Not when
How it is drawn
- Lanes: one row per actor in one framed panel, the name in bold at the left, thin lines between the rows; two to five lanes, the reader's own named "You".
- Steps: one box per step, left to right in order, each in the lane of who does it; a verb in bold and a few words under it.
- Arrows: from each step to the next, down or up out of the box and then right into the next one; the arrowheads touch the boxes.
- Colours: green for steps done, grey dashed for steps to come. A hand-off that waits on the reader is amber, its arrow too, and says for how long.
- Now: a blue box under the panel says in one sentence who holds the work and what it waits on.
# Swimlanes: who does each step
A process as its steps in order, a lane per actor, each step a box in
the lane of who does it. An arrow leads from each step to the next, and
it crosses lanes where the work changes hands. The reader sees who holds
the work now and which hand-off waits on them.
## Fits when
- **Several people or services share one process,** each doing a part
of it in turn.
- **The question is who does what,** and where the work passes from one
to another.
- **A hand-off is slow or stuck,** and the reader sees whose lane it
waits in, often their own.
## Not when
- **Messages between parts of a system,** in time order: a
[sequence diagram](https://github.com/vbarbarosh/rules/blob/main/diagrams/sequence.md).
- **Decisions** with yes and no branches: a
[flowchart](https://github.com/vbarbarosh/rules/blob/main/diagrams/flowchart.md).
- **A thing's states** and what moves it between them: a
[state diagram](https://github.com/vbarbarosh/rules/blob/main/diagrams/state.md).
- **Many pieces of work** by stage, not one process: a
[kanban board](https://github.com/vbarbarosh/rules/blob/main/diagrams/kanban.md).
## How it is drawn
1. **Lanes:** one row per actor in one framed panel, the name in bold
at the left, thin lines between the rows; two to five lanes, the
reader's own named "You".
2. **Steps:** one box per step, left to right in order, each in the
lane of who does it; a verb in bold and a few words under it.
3. **Arrows:** from each step to the next, down or up out of the box and
then right into the next one; the arrowheads touch the boxes.
4. **Colours:** green for steps done, grey dashed for steps to come. A
hand-off that waits on the reader is amber, its arrow too, and says
for how long.
5. **Now:** a blue box under the panel says in one sentence who holds
the work and what it waits on.
08Step tree: a process as its stages and their small steps
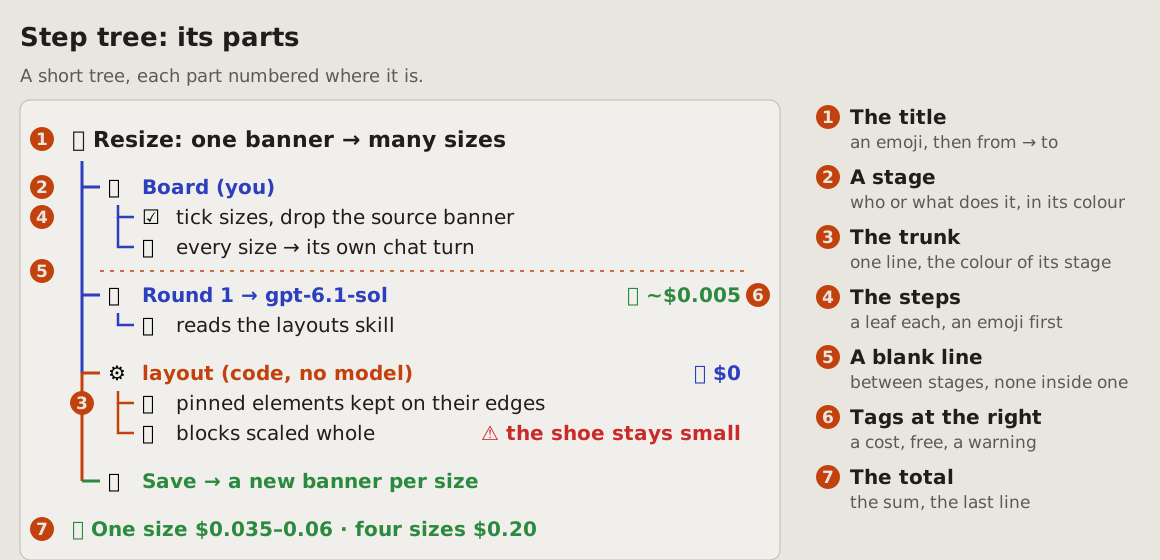
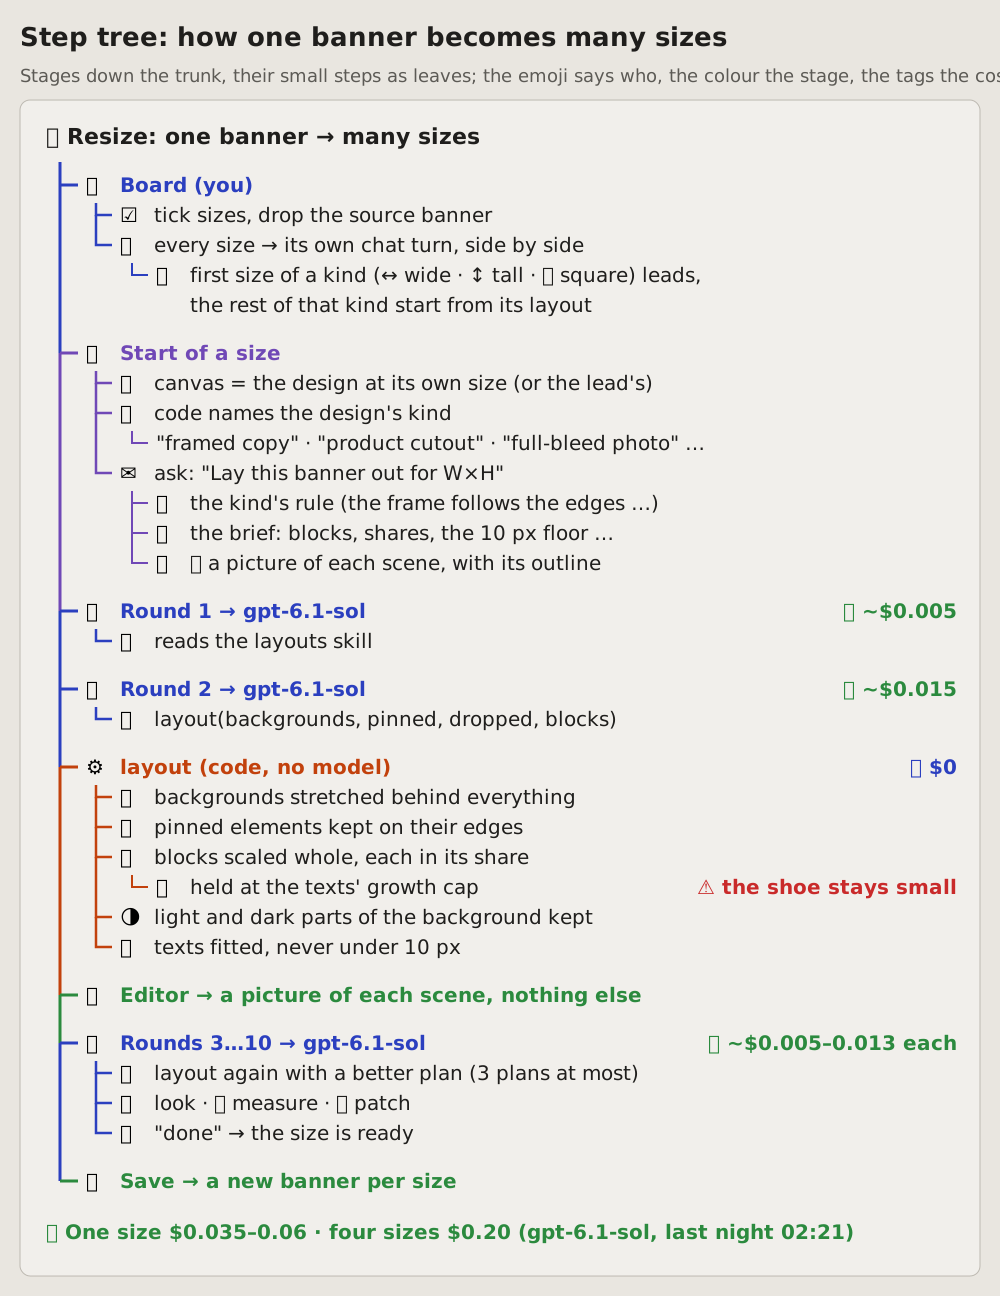
A process read top to bottom: one trunk down the left, a branch per stage, and under each stage its small steps as leaves. Every node starts with an emoji: the stage's says who or what does it, the step's what it does. Each stage has its colour, and the trunk takes it as it passes. A blank line between stages, none inside one, so the eye finds the stages before it reads a word. A cost or a warning stands at the right of the row it belongs to; the total closes the tree.
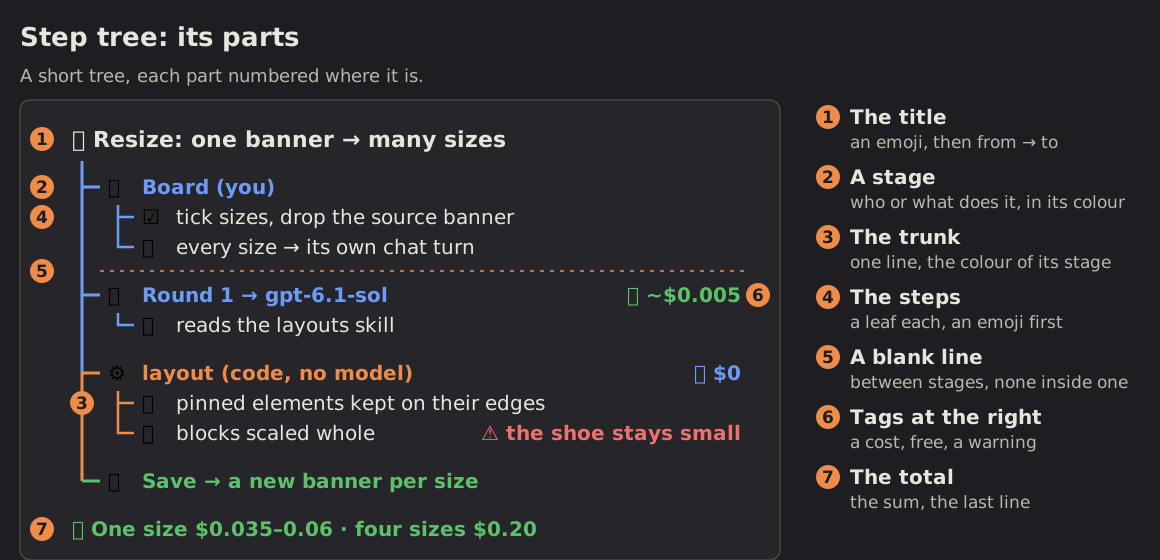
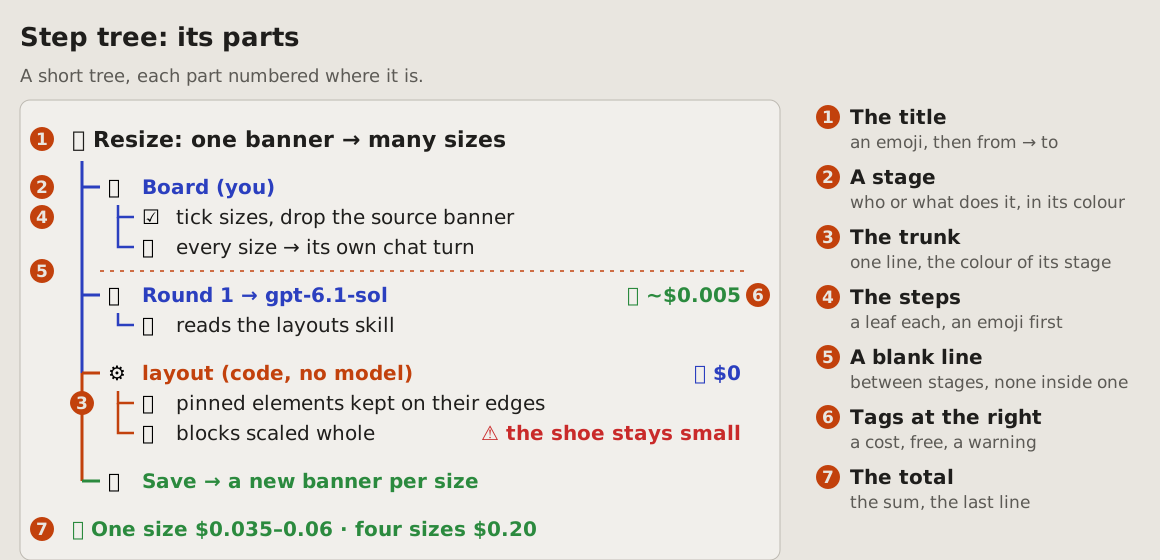
Its parts, numbered where they are:
Fits when
- A process of a few stages, each of a few small operations: what a feature does from the click to the result, a job round by round, a build step by step.
- Different hands do the stages: the user, a model, plain code, an editor; the emoji of the stage says which.
- A step has a price or a catch worth reading beside it: what a round costs, where it waits, where it goes wrong.
Not when
- One action branches on what it finds: a flowchart.
- Who holds the work, and where it changes hands between people: swimlanes.
- A whole and its parts with no order between them: a breakdown tree.
- What happened when, with its times: a chronology or a timeline.
- Files in and files out of a script: a pipeline.
How it is drawn
- The title: on top, an emoji, the name of the process and what it turns into what ("Resize: one banner → many sizes"); in monospace, as the whole tree.
- The trunk: one line down the left, from under the title to the last stage; it takes the colour of the stage it has just passed.
- Stages: a branch each off the trunk, in order; an emoji for who or what does it (👤 the user, 🤖 a model, ⚙️ code, 📸 the editor, 🔁 a loop, 💾 save), then its name in bold, in its colour: blue for the user and the model, purple for the start, amber for code, green for what comes out.
- Steps: the leaves of a stage, each a line with its own emoji then a few words; a step of a step one level deeper, three levels at most; a long line wraps under its own words, not under the emoji.
- Blank lines: one between stages, none inside a stage: the gap is what tells one stage from the next.
- Tags at the right: aligned on one right edge, on the row they belong to: a cost in green with 💵, free in blue with 🆓, a warning in red with ⚠️ and its words.
- The total: the last line, 💰 and the sum: one case and many, and where the number comes from.
- Emoji: one per node, never two; the same emoji means the same thing throughout (📐 a layout, 📸 a picture, ✅ done), and a reader who knows none of them still reads the words.
# Step tree: a process as its stages and their small steps
A process read top to bottom: one trunk down the left, a branch per
stage, and under each stage its small steps as leaves. Every node starts
with an emoji: the stage's says who or what does it, the step's what it
does. Each stage has its colour, and the trunk takes it as it passes. A
blank line between stages, none inside one, so the eye finds the stages
before it reads a word. A cost or a warning stands at the right of the
row it belongs to; the total closes the tree.
Its parts, numbered where they are:
## Fits when
- **A process of a few stages, each of a few small operations:** what a
feature does from the click to the result, a job round by round, a
build step by step.
- **Different hands do the stages:** the user, a model, plain code, an
editor; the emoji of the stage says which.
- **A step has a price or a catch** worth reading beside it: what a
round costs, where it waits, where it goes wrong.
## Not when
- **One action branches** on what it finds: a [flowchart](https://github.com/vbarbarosh/rules/blob/main/diagrams/flowchart.md).
- **Who holds the work,** and where it changes hands between people:
[swimlanes](https://github.com/vbarbarosh/rules/blob/main/diagrams/swimlanes.md).
- **A whole and its parts** with no order between them: a
[breakdown tree](https://github.com/vbarbarosh/rules/blob/main/diagrams/breakdown.md).
- **What happened when,** with its times: a [chronology](https://github.com/vbarbarosh/rules/blob/main/diagrams/chronology.md)
or a [timeline](https://github.com/vbarbarosh/rules/blob/main/diagrams/timeline.md).
- **Files in and files out** of a script: a [pipeline](https://github.com/vbarbarosh/rules/blob/main/diagrams/pipeline.md).
## How it is drawn
1. **The title:** on top, an emoji, the name of the process and what it
turns into what ("Resize: one banner → many sizes"); in monospace, as
the whole tree.
2. **The trunk:** one line down the left, from under the title to the
last stage; it takes the colour of the stage it has just passed.
3. **Stages:** a branch each off the trunk, in order; an emoji for who or
what does it (👤 the user, 🤖 a model, ⚙️ code, 📸 the editor, 🔁 a
loop, 💾 save), then its name in bold, in its colour: blue for the
user and the model, purple for the start, amber for code, green for
what comes out.
4. **Steps:** the leaves of a stage, each a line with its own emoji then
a few words; a step of a step one level deeper, three levels at most;
a long line wraps under its own words, not under the emoji.
5. **Blank lines:** one between stages, none inside a stage: the gap is
what tells one stage from the next.
6. **Tags at the right:** aligned on one right edge, on the row they
belong to: a cost in green with 💵, free in blue with 🆓, a warning
in red with ⚠️ and its words.
7. **The total:** the last line, 💰 and the sum: one case and many, and
where the number comes from.
8. **Emoji:** one per node, never two; the same emoji means the same
thing throughout (📐 a layout, 📸 a picture, ✅ done), and a reader
who knows none of them still reads the words.
09Known and open questions: how it works, and the gaps
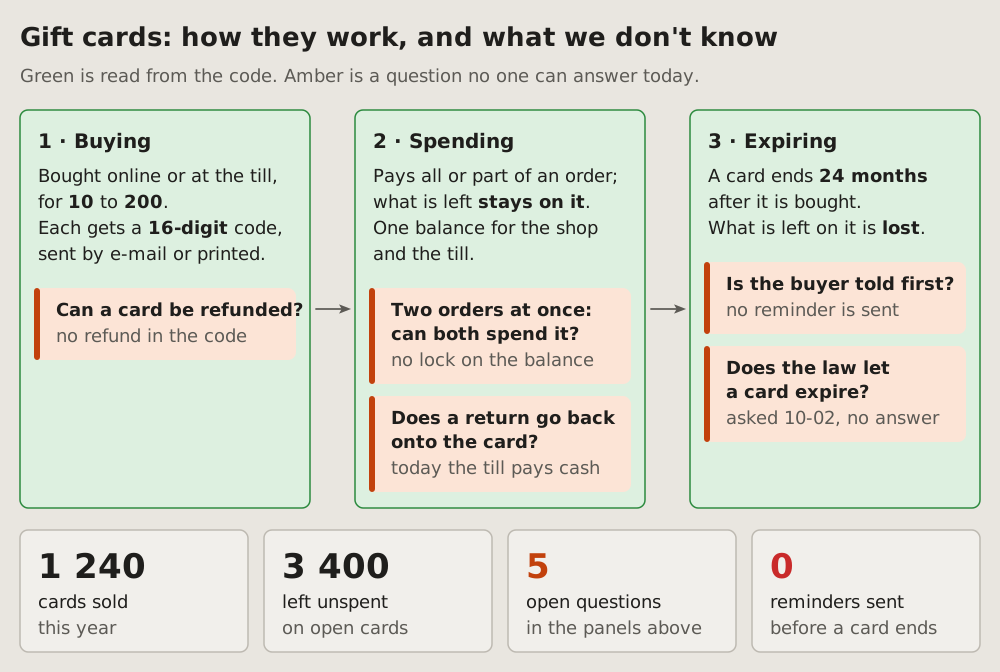
How something works, stage by stage, with the facts read from the code and the questions no one can answer yet, each where it arises. A panel per stage, left to right; the questions inside the panel they belong to; a row of big numbers under them.
Fits when
- Someone asks how a thing works, and part of the answer is "no one knows yet".
- The facts and the gaps must be told apart: what the code says, beside what a person still has to decide or find out.
- A meeting needs its questions: each one shown where it bites, not in a list at the end.
Not when
How it is drawn
- The title says both halves: "how it works, and what we don't know", and the line under it says what green and amber mean.
- Stages: a green panel each, numbered "1 · Buying", left to right, an arrow between them; a few short lines of facts, the key figures in bold.
- Questions: an amber note inside the panel where the question arises, a thick amber bar on its left; the question in bold, and in grey what is known so far.
- Big numbers: a row under the panels, each a number and two lines of what it counts; amber or red when it stands for a gap.
- Facts only in green: a line in a green panel is read from the code or a log; a guess is a question, and goes in amber.
# Known and open questions: how it works, and the gaps
How something works, stage by stage, with the facts read from the code
and the questions no one can answer yet, each where it arises. A panel per
stage, left to right; the questions inside the panel they belong to; a row
of big numbers under them.
## Fits when
- **Someone asks how a thing works,** and part of the answer is "no one
knows yet".
- **The facts and the gaps must be told apart:** what the code says,
beside what a person still has to decide or find out.
- **A meeting needs its questions:** each one shown where it bites, not
in a list at the end.
## Not when
- **What is decided where,** step by step: a
[flowchart](https://github.com/vbarbarosh/rules/blob/main/diagrams/flowchart.md).
- **A thing's states** and what moves it between them: a
[state diagram](https://github.com/vbarbarosh/rules/blob/main/diagrams/state.md).
- **Where many parts stand:** a [status dashboard](https://github.com/vbarbarosh/rules/blob/main/diagrams/dashboard.md).
## How it is drawn
1. **The title says both halves:** "how it works, and what we don't
know", and the line under it says what green and amber mean.
2. **Stages:** a green panel each, numbered "1 · Buying", left to right,
an arrow between them; a few short lines of facts, the key figures in
bold.
3. **Questions:** an amber note inside the panel where the question
arises, a thick amber bar on its left; the question in bold, and in
grey what is known so far.
4. **Big numbers:** a row under the panels, each a number and two lines
of what it counts; amber or red when it stands for a gap.
5. **Facts only in green:** a line in a green panel is read from the
code or a log; a guess is a question, and goes in amber.
10Cause tree: why it happened
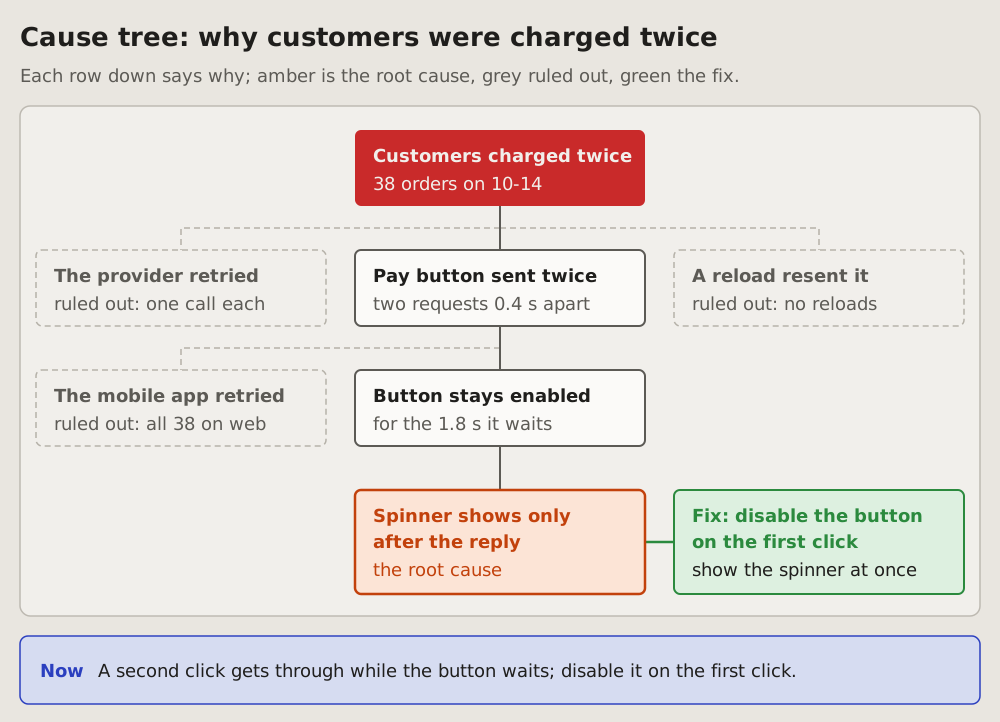
The failure on top, its causes below it as a tree: each row down says why the row above happened. The root cause is amber, the fix green beside it, and the causes that were checked and ruled out stay in grey with the reason. The reader sees why it broke, what one change ends it, and what was already looked at.
Fits when
- Something broke and the question is why, down to the one cause a change would end.
- Several causes were suspected, and the reader sees which were checked and why they are out.
- The fix follows from the cause, and the reader sees it is aimed at the root, not at the failure on top.
Not when
- The order of events in one request: a sequence diagram; what happened when, from a log: a timeline.
- The cause is not found yet: what is known and what is still open, a questions diagram.
- One real request today beside the same with the fix: a case.
How it is drawn
- The failure: a red box on top, what broke in a few words and, under it, how much or since when.
- The causes: one box per row down, each the "because" of the box above it, its name in bold in two or three words and under it what shows it; dark lines join the chain from the failure to the root.
- Ruled out: a grey box with a dashed border beside the cause it was checked against, its name in grey and "ruled out:" with the reason; grey dashed lines join it.
- The root cause: the last box of the chain, amber with an amber border, its name in bold and "the root cause" under it.
- The fix: a green box beside the root cause, joined to it by a green line, the change in bold.
- Now: a blue box under the tree says in one sentence why it broke and what fixes it.
# Cause tree: why it happened
The failure on top, its causes below it as a tree: each row down says
why the row above happened. The root cause is amber, the fix green
beside it, and the causes that were checked and ruled out stay in grey
with the reason. The reader sees why it broke, what one change ends it,
and what was already looked at.
## Fits when
- **Something broke and the question is why,** down to the one cause a
change would end.
- **Several causes were suspected,** and the reader sees which were
checked and why they are out.
- **The fix follows from the cause,** and the reader sees it is aimed at
the root, not at the failure on top.
## Not when
- **The order of events** in one request: a
[sequence diagram](https://github.com/vbarbarosh/rules/blob/main/diagrams/sequence.md); what happened when, from a log: a
[timeline](https://github.com/vbarbarosh/rules/blob/main/diagrams/timeline.md).
- **The cause is not found yet:** what is known and what is still open,
a [questions diagram](https://github.com/vbarbarosh/rules/blob/main/diagrams/questions.md).
- **One real request today beside the same with the fix:** a
[case](https://github.com/vbarbarosh/rules/blob/main/diagrams/case.md).
## How it is drawn
1. **The failure:** a red box on top, what broke in a few words and,
under it, how much or since when.
2. **The causes:** one box per row down, each the "because" of the box
above it, its name in bold in two or three words and under it what
shows it; dark lines join the chain from the failure to the root.
3. **Ruled out:** a grey box with a dashed border beside the cause it
was checked against, its name in grey and "ruled out:" with the
reason; grey dashed lines join it.
4. **The root cause:** the last box of the chain, amber with an amber
border, its name in bold and "the root cause" under it.
5. **The fix:** a green box beside the root cause, joined to it by a
green line, the change in bold.
6. **Now:** a blue box under the tree says in one sentence why it broke
and what fixes it.
11Timeline: what happened when
Events at their moments, from a log: one line of time, left to right, each event a dot with its time and a few words.
Fits when
- A log tells it: times matter, and the gaps between them.
- The question is what came before what, or what happened while something else waited.
- One event went wrong among others that did not.
Not when
- Who sent what to whom matters more than when: a sequence diagram.
- The times do not matter, only the order of states: a state diagram.
- Hundreds of events: pick the few that tell it, and say how many were left out.
How it is drawn
- The line of time: one grey line, left to right.
- Events: a dot on the line, a stem to its label, the time in bold above a few words. The labels go above and below in turn, so close events do not collide.
- Colours: blue for what went as it should, green for an end that is wanted, red for what went wrong.
- What went wrong gets a note of its own, in red, under its event.
# Timeline: what happened when
Events at their moments, from a log: one line of time, left to right, each
event a dot with its time and a few words.
## Fits when
- **A log tells it:** times matter, and the gaps between them.
- **The question is what came before what,** or what happened while
something else waited.
- **One event went wrong** among others that did not.
## Not when
- **Who sent what to whom** matters more than when: a
[sequence diagram](https://github.com/vbarbarosh/rules/blob/main/diagrams/sequence.md).
- **The times do not matter,** only the order of states: a
[state diagram](https://github.com/vbarbarosh/rules/blob/main/diagrams/state.md).
- **Hundreds of events:** pick the few that tell it, and say how many were
left out.
## How it is drawn
1. **The line of time:** one grey line, left to right.
2. **Events:** a dot on the line, a stem to its label, the time in bold
above a few words. The labels go above and below in turn, so close
events do not collide.
3. **Colours:** blue for what went as it should, green for an end that is
wanted, red for what went wrong.
4. **What went wrong** gets a note of its own, in red, under its event.
12Chronology: what one user did, in order
Steps in the order they happened, each with its time, at even distances: the order and the times count, not the gaps between them. A long gap is cut short, its length written on the cut.
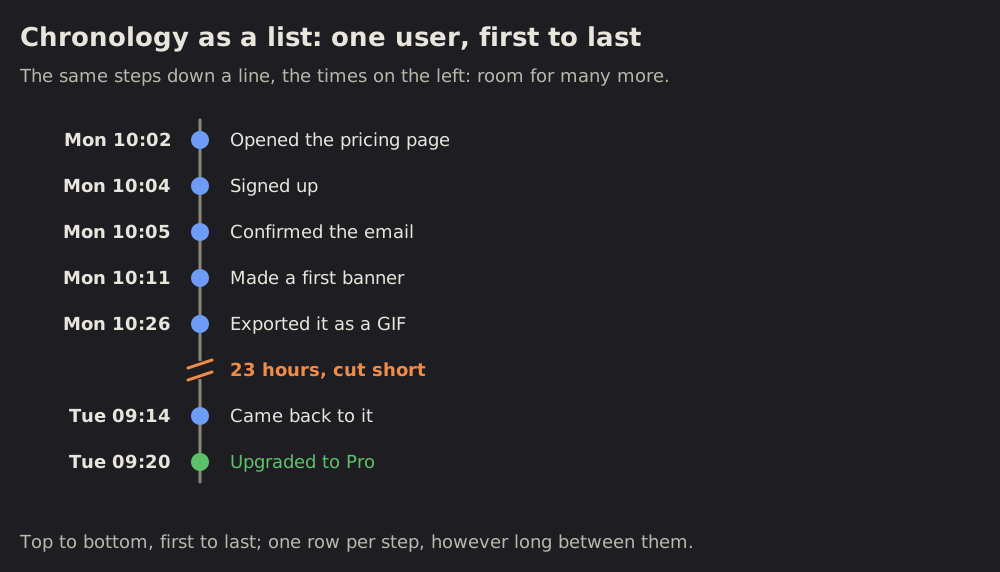
For more steps than a strip holds, the same chronology goes down a line, the times on the left, one row per step.
Fits when
- One actor's steps: a user, a job, an agent; first this, then that.
- The order matters more than the distances: a minute and a night between two steps take the same room.
- Steps far apart in time: minutes, then a day, then a week; a timeline would squeeze the short ones flat.
Not when
- The gaps are the story: a wait, a timeout, what happened while something else waited: a timeline.
- Several parts pass something between them: a sequence diagram.
- The states matter, not the steps: a state diagram.
How it is drawn
- The line: one grey line, left to right in the strip, top to bottom in the list.
- Steps: a dot each, at even distances. In the strip, a stem to its label, the time in bold above a few words, the labels above and below in turn; in the list, the time on the left, the words on the right.
- Colours: blue for each step, green for the end that is wanted, red for a step that went wrong.
- A long gap: the line cut by two slanted amber strokes, its length written in amber on the cut.
- Strip or list: a strip up to seven or eight steps; more, the list.
# Chronology: what one user did, in order
Steps in the order they happened, each with its time, at even distances:
the order and the times count, not the gaps between them. A long gap is
cut short, its length written on the cut.
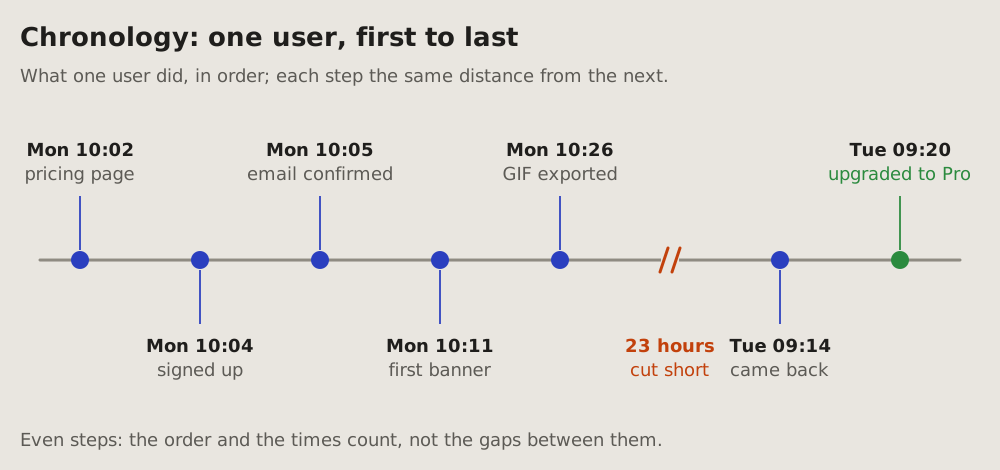
For more steps than a strip holds, the same chronology goes down a line,
the times on the left, one row per step.
## Fits when
- **One actor's steps:** a user, a job, an agent; first this, then that.
- **The order matters more than the distances:** a minute and a night
between two steps take the same room.
- **Steps far apart in time:** minutes, then a day, then a week; a
[timeline](https://github.com/vbarbarosh/rules/blob/main/diagrams/timeline.md) would squeeze the short ones flat.
## Not when
- **The gaps are the story:** a wait, a timeout, what happened while
something else waited: a [timeline](https://github.com/vbarbarosh/rules/blob/main/diagrams/timeline.md).
- **Several parts pass something between them:** a
[sequence diagram](https://github.com/vbarbarosh/rules/blob/main/diagrams/sequence.md).
- **The states matter, not the steps:** a [state diagram](https://github.com/vbarbarosh/rules/blob/main/diagrams/state.md).
## How it is drawn
1. **The line:** one grey line, left to right in the strip, top to bottom
in the list.
2. **Steps:** a dot each, at even distances. In the strip, a stem to its
label, the time in bold above a few words, the labels above and below
in turn; in the list, the time on the left, the words on the right.
3. **Colours:** blue for each step, green for the end that is wanted, red
for a step that went wrong.
4. **A long gap:** the line cut by two slanted amber strokes, its length
written in amber on the cut.
5. **Strip or list:** a strip up to seven or eight steps; more, the list.
13Event plot: who did what, when
Every event of many actors at its moment: a lane per actor, a tick per event at its time, coloured by its kind. Also called a raster plot; told as a timeline, a swimlane timeline.
Fits when
- Many actors, one log: accounts, users, jobs or services, each with its events over the same hours.
- When and by whom matter together: bursts, quiet hours, who works when, what one actor did before another.
- Every event counts: a single delete in a lane of saves shows as one red tick.
Not when
How it is drawn
- Lanes: one per actor, its name on the left; the busiest on top.
- The time: one axis under the lanes, thin grey lines at even hours.
- Ticks: a thin bar per event at its time, coloured by its kind, a legend of the kinds on top.
- Totals: at the end of each lane, how many events it holds.
- Noise: health checks, bots, staff in a lane of their own, under the rest; the many quiet actors folded into one lane, "31 other accounts".
# Event plot: who did what, when
Every event of many actors at its moment: a lane per actor, a tick per
event at its time, coloured by its kind. Also called a raster plot; told
as a timeline, a swimlane timeline.
## Fits when
- **Many actors, one log:** accounts, users, jobs or services, each with
its events over the same hours.
- **When and by whom matter together:** bursts, quiet hours, who works
when, what one actor did before another.
- **Every event counts:** a single delete in a lane of saves shows as one
red tick.
## Not when
- **One actor's steps:** a [chronology](https://github.com/vbarbarosh/rules/blob/main/diagrams/chronology.md), or a
[timeline](https://github.com/vbarbarosh/rules/blob/main/diagrams/timeline.md) when the gaps matter.
- **Only how many, by hour and day:** a [heatmap](https://github.com/vbarbarosh/rules/blob/main/diagrams/heatmap.md) counts them
in cells.
- **What each actor sends the others:** a
[sequence diagram](https://github.com/vbarbarosh/rules/blob/main/diagrams/sequence.md).
## How it is drawn
1. **Lanes:** one per actor, its name on the left; the busiest on top.
2. **The time:** one axis under the lanes, thin grey lines at even hours.
3. **Ticks:** a thin bar per event at its time, coloured by its kind, a
legend of the kinds on top.
4. **Totals:** at the end of each lane, how many events it holds.
5. **Noise:** health checks, bots, staff in a lane of their own, under
the rest; the many quiet actors folded into one lane, "31 other
accounts".
14Milestone track: where a goal stands
One goal and its steps on a line, left to right: the steps done, the step now, the steps ahead, and who each one waits on.
Fits when
- One goal, a few steps: four to seven, each done or not.
- The question is what is next and who it waits on: the reader or the agent.
- The same track is shown again later, and the reader sees how far it moved.
Not when
- What happened when matters, not what is left: a timeline.
- A thing's states and what moves it between them: a state diagram.
- Many parts at once, each with its own state: a status dashboard.
How it is drawn
- The band: one framed panel; a flag, the goal's name in bold and how many steps are done, in blue, beside it.
- The steps: dots on one line, left to right. A done step is green with a tick, a green line up to the step now; the step now is a blue ring with its number; the steps ahead are grey, numbered, on a grey line.
- Under each dot: its name in a word or two, and under that its date when done, or who it waits on: "waits on you" in amber for the step now, "by you" or "by me" for the steps ahead.
- Now: a blue box under the line names the step now and what it waits on, in one sentence.
# Milestone track: where a goal stands
One goal and its steps on a line, left to right: the steps done, the step
now, the steps ahead, and who each one waits on.
## Fits when
- **One goal, a few steps:** four to seven, each done or not.
- **The question is what is next** and who it waits on: the reader or
the agent.
- **The same track is shown again later,** and the reader sees how far
it moved.
## Not when
- **What happened when** matters, not what is left: a
[timeline](https://github.com/vbarbarosh/rules/blob/main/diagrams/timeline.md).
- **A thing's states** and what moves it between them: a
[state diagram](https://github.com/vbarbarosh/rules/blob/main/diagrams/state.md).
- **Many parts at once,** each with its own state: a
[status dashboard](https://github.com/vbarbarosh/rules/blob/main/diagrams/dashboard.md).
## How it is drawn
1. **The band:** one framed panel; a flag, the goal's name in bold and
how many steps are done, in blue, beside it.
2. **The steps:** dots on one line, left to right. A done step is green
with a tick, a green line up to the step now; the step now is a blue
ring with its number; the steps ahead are grey, numbered, on a grey
line.
3. **Under each dot:** its name in a word or two, and under that its
date when done, or who it waits on: "waits on you" in amber for the
step now, "by you" or "by me" for the steps ahead.
4. **Now:** a blue box under the line names the step now and what it
waits on, in one sentence.
15Plan graph: what waits on what
A plan's parts as boxes, an arrow from each part to the parts that wait on it. Parts that can run side by side stand in one column. The longest chain is bold blue: it sets the day the plan ends.
Fits when
- A plan in parts, some of which wait on others and some of which can run at the same time.
- The question is what holds the end date: which parts must not slip, and which have time to spare.
- A part waits on the reader, and the reader sees how much waits behind it.
Not when
- One goal's steps in a line, one after another: a milestone track.
- The months ahead, bars against dates: a roadmap.
- Work by stage today, not by what it waits on: a kanban board.
- What is decided where, questions and their answers: a flowchart.
How it is drawn
- The parts: one box per part, its name in bold, P1, P2 and so on with a few words; under it how long it takes and where it stands. Three to eight parts.
- The columns: left to right in the order the parts can start, the days on top. Parts that can run side by side are stacked in one column.
- The arrows: from a part to each part that waits on it, from box edge to box edge, thin grey.
- The longest chain: its arrows bold blue, so the reader sees which parts move the end date and which can slip.
- Where each stands: green is done, blue under way, grey with a dashed border not started, amber with "waits on you" a part the reader must do or approve.
- Now: a blue box under the panel says in one sentence what holds the end date, what has time to spare and what waits on the reader.
# Plan graph: what waits on what
A plan's parts as boxes, an arrow from each part to the parts that wait
on it. Parts that can run side by side stand in one column. The longest
chain is bold blue: it sets the day the plan ends.
## Fits when
- **A plan in parts,** some of which wait on others and some of which
can run at the same time.
- **The question is what holds the end date:** which parts must not
slip, and which have time to spare.
- **A part waits on the reader,** and the reader sees how much waits
behind it.
## Not when
- **One goal's steps in a line,** one after another: a
[milestone track](https://github.com/vbarbarosh/rules/blob/main/diagrams/milestone.md).
- **The months ahead,** bars against dates: a [roadmap](https://github.com/vbarbarosh/rules/blob/main/diagrams/roadmap.md).
- **Work by stage today,** not by what it waits on: a
[kanban board](https://github.com/vbarbarosh/rules/blob/main/diagrams/kanban.md).
- **What is decided where,** questions and their answers: a
[flowchart](https://github.com/vbarbarosh/rules/blob/main/diagrams/flowchart.md).
## How it is drawn
1. **The parts:** one box per part, its name in bold, P1, P2 and so on
with a few words; under it how long it takes and where it stands.
Three to eight parts.
2. **The columns:** left to right in the order the parts can start, the
days on top. Parts that can run side by side are stacked in one
column.
3. **The arrows:** from a part to each part that waits on it, from box
edge to box edge, thin grey.
4. **The longest chain:** its arrows bold blue, so the reader sees which
parts move the end date and which can slip.
5. **Where each stands:** green is done, blue under way, grey with a
dashed border not started, amber with "waits on you" a part the
reader must do or approve.
6. **Now:** a blue box under the panel says in one sentence what holds
the end date, what has time to spare and what waits on the reader.
16Roadmap: what is planned when
The months ahead on one line of time, a lane per area of work, each piece of work a bar from its start to its end; a red line marks today. The reader sees what is done, what is under way, what is at risk and what comes next.
Fits when
- Several areas of work over months: what each one does when, side by side.
- The question is what comes next and what is late, measured against today.
- One piece of work waits on another, and the reader sees the delay push the next one.
Not when
How it is drawn
- Time: the months left to right in one framed panel, their names on top; four to twelve of them.
- Lanes: one row per area of work, its name in bold on the left, thin lines between the rows; two to five lanes.
- Bars: one per piece of work, from its start to its end, its name inside in two or three words. Green is done, blue under way, amber at risk with its name in amber, grey with a dashed border planned.
- Today: a red dashed line down the panel, behind the bars, its date on a red pill at the bottom.
- Now: a blue box under the panel says in one sentence what is under way and what is at risk, and why.
# Roadmap: what is planned when
The months ahead on one line of time, a lane per area of work, each piece
of work a bar from its start to its end; a red line marks today. The
reader sees what is done, what is under way, what is at risk and what
comes next.
## Fits when
- **Several areas of work over months:** what each one does when, side
by side.
- **The question is what comes next** and what is late, measured against
today.
- **One piece of work waits on another,** and the reader sees the delay
push the next one.
## Not when
- **One goal and its steps,** done or not, no dates ahead: a
[milestone track](https://github.com/vbarbarosh/rules/blob/main/diagrams/milestone.md).
- **Work by stage today,** not by month: a [kanban board](https://github.com/vbarbarosh/rules/blob/main/diagrams/kanban.md).
- **What already happened,** from a log: a [timeline](https://github.com/vbarbarosh/rules/blob/main/diagrams/timeline.md).
## How it is drawn
1. **Time:** the months left to right in one framed panel, their names
on top; four to twelve of them.
2. **Lanes:** one row per area of work, its name in bold on the left,
thin lines between the rows; two to five lanes.
3. **Bars:** one per piece of work, from its start to its end, its name
inside in two or three words. Green is done, blue under way, amber at
risk with its name in amber, grey with a dashed border planned.
4. **Today:** a red dashed line down the panel, behind the bars, its date
on a red pill at the bottom.
5. **Now:** a blue box under the panel says in one sentence what is
under way and what is at risk, and why.
17Kanban board: where each piece of work is
Many pieces of work at once, each in the column of its stage: to do, doing, in review, done. The board says what is in flight, where work piles up, and what waits on whom.
Fits when
- Many pieces of work at once, each in one stage, none of them the whole goal.
- The question is what is in flight: what is stuck, what piles up before a stage, what waits on the reader.
- A stage has a limit, and the reader sees it is full before more work is started.
Not when
How it is drawn
- The columns: one framed column per stage, left to right in the order work moves; three to five of them.
- The header: the stage's name in bold, its count at the right. A stage with a limit shows "3 of 3" in blue when full; red when over.
- The cards: one per piece of work, its name in bold in two or three words, under it who it is by and how long it has been there.
- What stands out: a card that waits on the reader is amber with "waits on you"; a blocked card has a red border and says for how long; a done card has a green tick and its date.
- Long columns: a few cards are shown, the rest as "+ 3 more" under them; Done shows the newest first.
- Now: a blue box under the board says in one sentence what is stuck and what waits on whom.
# Kanban board: where each piece of work is
Many pieces of work at once, each in the column of its stage: to do,
doing, in review, done. The board says what is in flight, where work
piles up, and what waits on whom.
## Fits when
- **Many pieces of work at once,** each in one stage, none of them the
whole goal.
- **The question is what is in flight:** what is stuck, what piles up
before a stage, what waits on the reader.
- **A stage has a limit,** and the reader sees it is full before more
work is started.
## Not when
- **One goal and its steps** in order: a [milestone track](https://github.com/vbarbarosh/rules/blob/main/diagrams/milestone.md).
- **A thing's states** and what moves it between them: a
[state diagram](https://github.com/vbarbarosh/rules/blob/main/diagrams/state.md).
- **Parts of a system** and their health, not work to do: a
[status dashboard](https://github.com/vbarbarosh/rules/blob/main/diagrams/dashboard.md).
- **What happened when:** a [timeline](https://github.com/vbarbarosh/rules/blob/main/diagrams/timeline.md).
## How it is drawn
1. **The columns:** one framed column per stage, left to right in the
order work moves; three to five of them.
2. **The header:** the stage's name in bold, its count at the right. A
stage with a limit shows "3 of 3" in blue when full; red when over.
3. **The cards:** one per piece of work, its name in bold in two or three
words, under it who it is by and how long it has been there.
4. **What stands out:** a card that waits on the reader is amber with
"waits on you"; a blocked card has a red border and says for how long;
a done card has a green tick and its date.
5. **Long columns:** a few cards are shown, the rest as "+ 3 more" under
them; Done shows the newest first.
6. **Now:** a blue box under the board says in one sentence what is stuck
and what waits on whom.
18Priority quadrant: what to do first
Many pieces of work weighed on two things only: how much each is worth and how much it costs. Value goes up, effort goes right, and the square splits in four quarters: do first, plan, later, skip. The reader sees what to start with and what to drop.
Fits when
- Many ideas and room for a few, and the question is which ones to start with.
- Two things decide it: what a piece of work brings and what it costs, each a rough guess, not a measure.
- The reader must say no to some of them, and wants to see why.
Not when
- Work by stage today, in flight or stuck: a kanban board.
- The months ahead, what is planned when: a roadmap.
- Options compared on many criteria, not two: a table, a row per option and a column per criterion.
How it is drawn
- The axes: value up the left side, effort along the bottom, each an arrow with its name; no numbers, only more and less.
- The quarters: four framed boxes with a gap between them, each named in its outer corner in bold, what it means under the name. Do first is green, top left; plan is blue, top right; later is grey, bottom left; skip is grey with a dashed border, bottom right.
- The dots: one per piece of work, where its value and effort put it, in its quarter's colour; a skipped one is hollow. Four to twelve of them.
- The labels: the name in bold on its own light pill beside its dot, clear of the quarter's border and of other pills; right of the dot, or left when the right has no room.
- Now: a blue box under the panel says in one sentence what comes first and what is dropped.
# Priority quadrant: what to do first
Many pieces of work weighed on two things only: how much each is worth
and how much it costs. Value goes up, effort goes right, and the square
splits in four quarters: do first, plan, later, skip. The reader sees
what to start with and what to drop.
## Fits when
- **Many ideas and room for a few,** and the question is which ones to
start with.
- **Two things decide it:** what a piece of work brings and what it
costs, each a rough guess, not a measure.
- **The reader must say no** to some of them, and wants to see why.
## Not when
- **Work by stage today,** in flight or stuck: a
[kanban board](https://github.com/vbarbarosh/rules/blob/main/diagrams/kanban.md).
- **The months ahead,** what is planned when: a [roadmap](https://github.com/vbarbarosh/rules/blob/main/diagrams/roadmap.md).
- **Options compared on many criteria,** not two: a table, a row per
option and a column per criterion.
## How it is drawn
1. **The axes:** value up the left side, effort along the bottom, each
an arrow with its name; no numbers, only more and less.
2. **The quarters:** four framed boxes with a gap between them, each
named in its outer corner in bold, what it means under the name.
Do first is green, top left; plan is blue, top right; later is grey,
bottom left; skip is grey with a dashed border, bottom right.
3. **The dots:** one per piece of work, where its value and effort put
it, in its quarter's colour; a skipped one is hollow. Four to twelve
of them.
4. **The labels:** the name in bold on its own light pill beside its
dot, clear of the quarter's border and of other pills; right of the
dot, or left when the right has no room.
5. **Now:** a blue box under the panel says in one sentence what comes
first and what is dropped.
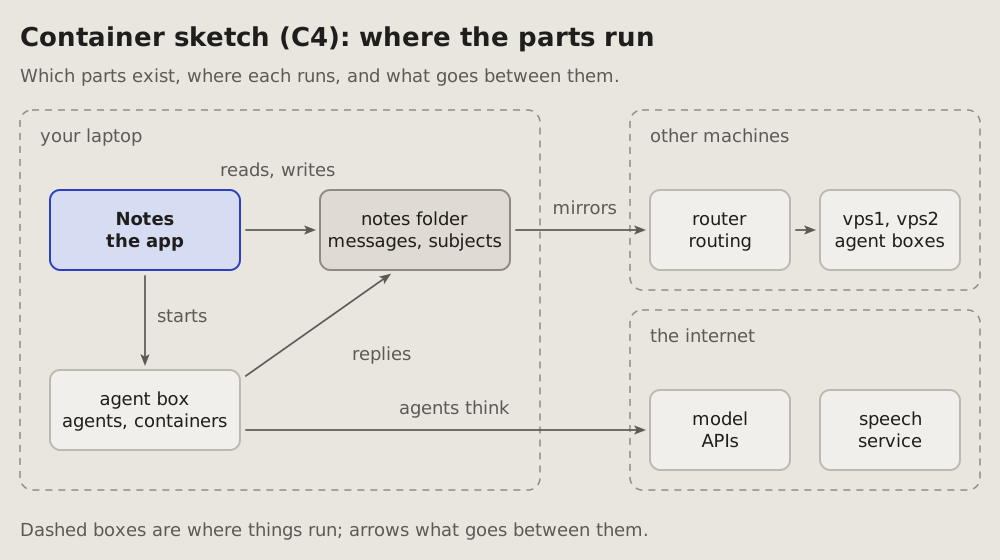
19Container sketch (C4): where the parts run
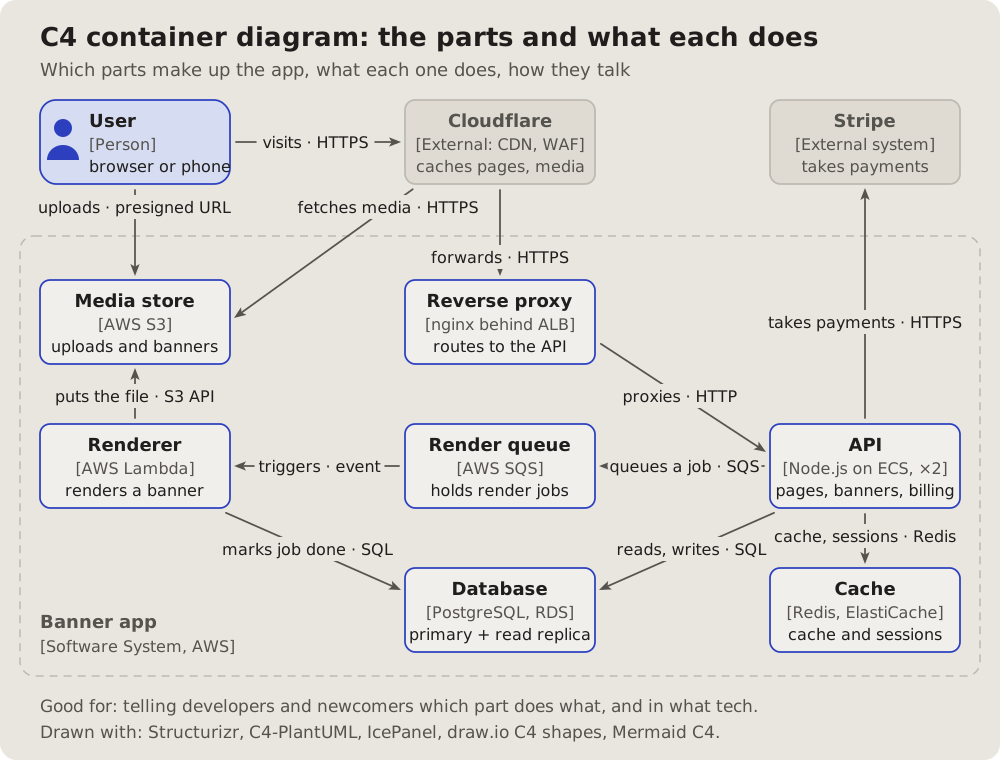
Which parts a system has, where each one runs, and what goes between them: the container level of the C4 model, drawn as a sketch.
Fits when
- The question is where: which machine, which box, which service runs a part.
- Something crosses a boundary: a laptop to a server, a box to the internet, and what goes across.
- A newcomer needs the whole before any one part.
Not when
How it is drawn
- Where things run: dashed boxes with their names at the top left (a laptop, other machines, the internet).
- Parts: boxes inside them, a name and one line of what each is; the one the reply is about in blue.
- What goes between them: the project's arrows, grey, each with a few words.
- Names: the standard ones from the glossary of names (laptop, router, vps1, box), never a private host.
Examples
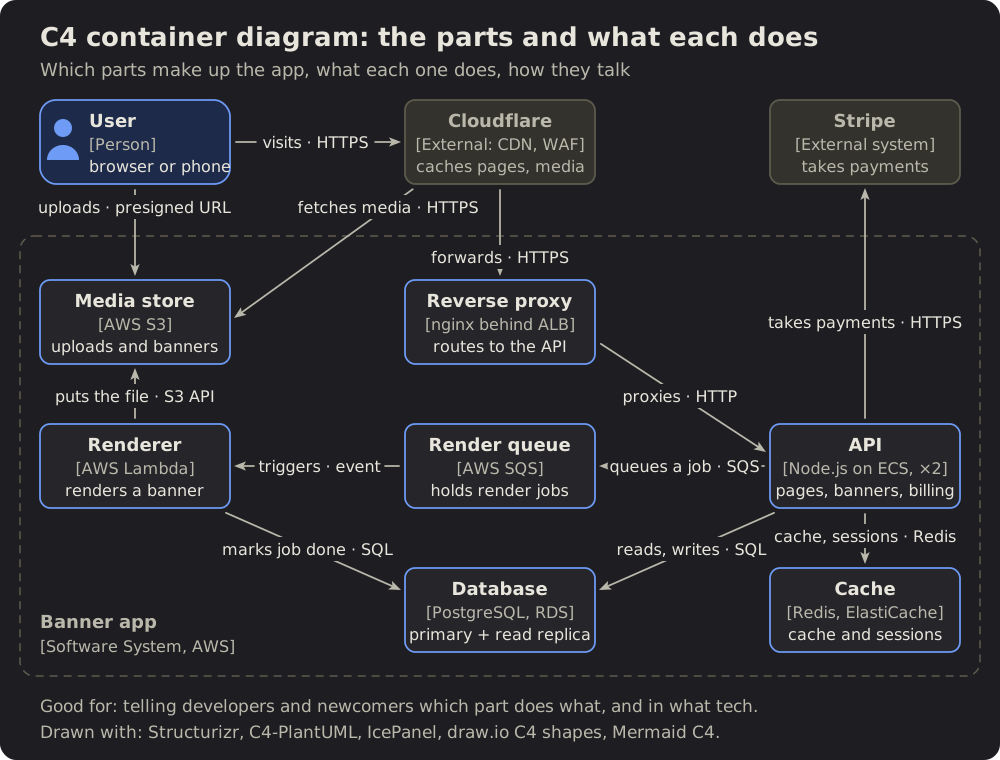
References
- The C4 model, by Simon Brown, its site and examples under CC BY 4.0: this sketch draws its container level; the picture is drawn here.
# Container sketch (C4): where the parts run
Which parts a system has, where each one runs, and what goes between them:
the container level of the C4 model, drawn as a sketch.
## Fits when
- **The question is where:** which machine, which box, which service runs
a part.
- **Something crosses a boundary:** a laptop to a server, a box to the
internet, and what goes across.
- **A newcomer needs the whole** before any one part.
## Not when
- **The order of the calls** matters: a [sequence diagram](https://github.com/vbarbarosh/rules/blob/main/diagrams/sequence.md).
- **The data and how it links** is the question: an
[entity-relationship diagram](https://github.com/vbarbarosh/rules/blob/main/diagrams/entities.md).
- **The inside of one part:** its states or its decisions, a
[state diagram](https://github.com/vbarbarosh/rules/blob/main/diagrams/state.md) or a [flowchart](https://github.com/vbarbarosh/rules/blob/main/diagrams/flowchart.md).
## How it is drawn
1. **Where things run:** dashed boxes with their names at the top left (a
laptop, other machines, the internet).
2. **Parts:** boxes inside them, a name and one line of what each is; the
one the reply is about in blue.
3. **What goes between them:** the project's arrows, grey, each with a few
words.
4. **Names:** the standard ones from the
[glossary of names](https://vbarbarosh.github.io/rules/docs/glossaries.html#NAMES) (laptop, router, vps1,
box), never a private host.
## Examples
## References
- [The C4 model](https://c4model.com), by Simon Brown, its site and
examples under CC BY 4.0: this sketch draws its container level; the
picture is drawn here.
20Entity-relationship: what data there is and how it links
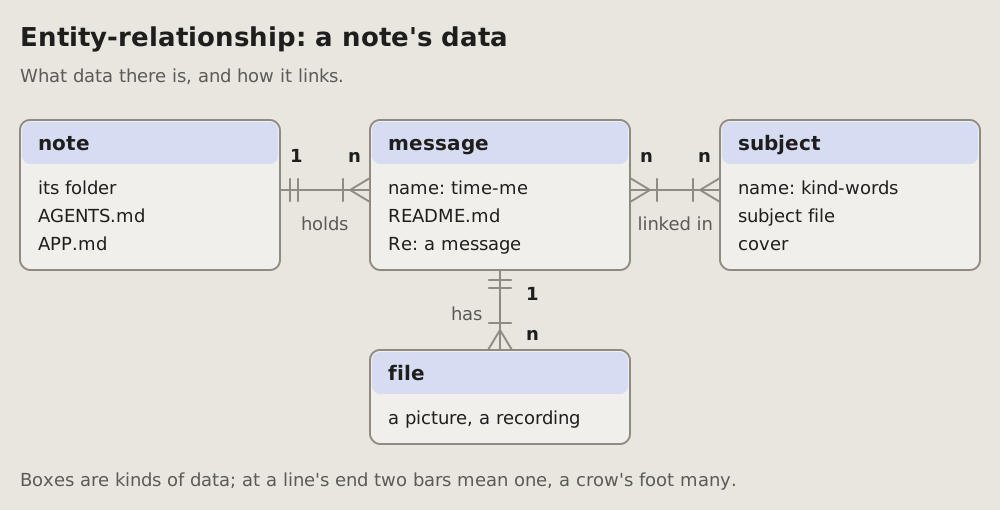
The kinds of data a system keeps, their main fields, and how many of one go with one of another: 1 to n, n to n, marked on each line's ends.
Fits when
- The question is about data: where something is kept, what points to what.
- A change touches a link: one becomes many, or a link goes away.
- A newcomer reads the storage before the code.
Not when
- Where the data lives (which machine, which service): a container sketch.
- What happens to one record over time: a state diagram.
- Every field of every table: keep the main ones; the schema is in the code.
How it is drawn
- Entities: a box per kind of data, its name in bold on a tinted band, its main fields under it.
- Links: plain lines, no arrowheads, a verb under the line (holds, has, linked in).
- Their ends, crow's feet: two short bars across the line where it is one, a three-pronged foot with a bar before it where it is many (one or more). 1 and n in bold beside them, for a reader who does not know the marks.
- Left to right in the order a reader meets them; a child under its parent.
# Entity-relationship: what data there is and how it links
The kinds of data a system keeps, their main fields, and how many of one go
with one of another: 1 to n, n to n, marked on each line's ends.
## Fits when
- **The question is about data:** where something is kept, what points to
what.
- **A change touches a link:** one becomes many, or a link goes away.
- **A newcomer reads the storage** before the code.
## Not when
- **Where the data lives** (which machine, which service): a
[container sketch](https://github.com/vbarbarosh/rules/blob/main/diagrams/containers.md).
- **What happens to one record over time:** a [state diagram](https://github.com/vbarbarosh/rules/blob/main/diagrams/state.md).
- **Every field of every table:** keep the main ones; the schema is in the
code.
## How it is drawn
1. **Entities:** a box per kind of data, its name in bold on a tinted band,
its main fields under it.
2. **Links:** plain lines, no arrowheads, a verb under the line (holds, has,
linked in).
3. **Their ends, crow's feet:** two short bars across the line where it is
one, a three-pronged foot with a bar before it where it is many (one or
more). **1** and **n** in bold beside them, for a reader who does not
know the marks.
4. **Left to right** in the order a reader meets them; a child under its
parent.
21Class diagram: the types of a program and how they link
The types of a program as boxes: each with its name, its main fields and its methods. The lines between them say how two types link: one is made of the other, one uses the other, one is a kind of the other.
Fits when
- The question is about types: what an object holds, what it can do, which other types it needs.
- A new kind joins a family: one more class under an interface, and the reader sees that nothing else changes.
- A newcomer reads the model of a program before its code.
Not when
- Which function calls which: a call graph.
- Which file needs which: a module graph.
- What data is stored and how it links: an entity-relationship diagram; a class diagram is the code's model, not the tables.
- Code with no types of its own, plain functions and data: there is nothing to box.
How it is drawn
- A type: a box in three parts. Its name in bold on a tinted band; its main fields under it,
name: type; its main methods at the bottom. An interface has «interface» over its name, the name in italics, no fields. - Made of: a plain line with a filled diamond at the whole; 1 and n in bold at the ends, a verb beside it.
- Uses: a dashed line with an arrowhead to the type used, a verb on it (pays with).
- A kind of: a dashed line with a hollow triangle at the interface it implements, or a plain one at the class it extends; several kinds share one triangle.
- What changes: a new type green, one that goes red and dashed; under it a word in its colour.
- Now: a blue box under the types says in one sentence what the diagram shows.
References
- archify, by tt-a1i, Apache-2.0 licence: an agent skill that draws this kind from typed JSON into an interactive page; the kind came to this page from it, the picture is drawn here.
# Class diagram: the types of a program and how they link
The types of a program as boxes: each with its name, its main fields and its
methods. The lines between them say how two types link: one is made of the
other, one uses the other, one is a kind of the other.
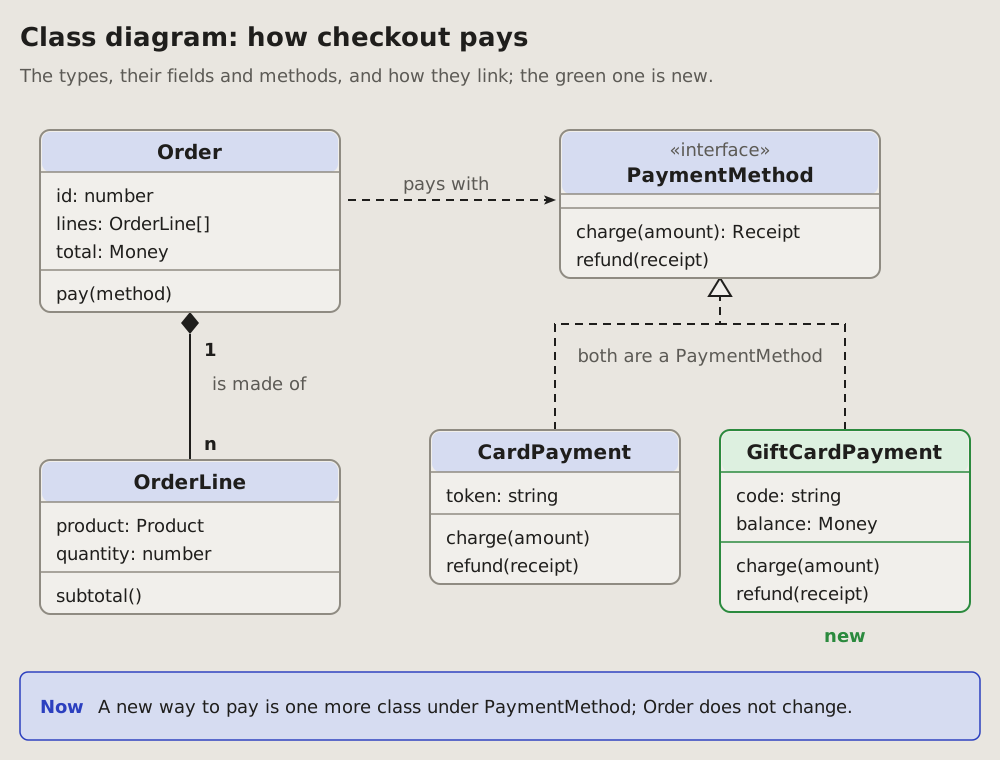
## Fits when
- **The question is about types:** what an object holds, what it can do,
which other types it needs.
- **A new kind joins a family:** one more class under an interface, and the
reader sees that nothing else changes.
- **A newcomer reads the model** of a program before its code.
## Not when
- **Which function calls which:** a [call graph](https://github.com/vbarbarosh/rules/blob/main/diagrams/callgraph.md).
- **Which file needs which:** a [module graph](https://github.com/vbarbarosh/rules/blob/main/diagrams/modules.md).
- **What data is stored and how it links:** an
[entity-relationship diagram](https://github.com/vbarbarosh/rules/blob/main/diagrams/entities.md); a class diagram is the code's
model, not the tables.
- **Code with no types of its own,** plain functions and data: there is
nothing to box.
## How it is drawn
1. **A type:** a box in three parts. Its name in bold on a tinted band; its
main fields under it, `name: type`; its main methods at the bottom. An
interface has «interface» over its name, the name in italics, no fields.
2. **Made of:** a plain line with a filled diamond at the whole; **1** and
**n** in bold at the ends, a verb beside it.
3. **Uses:** a dashed line with an arrowhead to the type used, a verb on it
(pays with).
4. **A kind of:** a dashed line with a hollow triangle at the interface it
implements, or a plain one at the class it extends; several kinds share
one triangle.
5. **What changes:** a new type green, one that goes red and dashed; under
it a word in its colour.
6. **Now:** a blue box under the types says in one sentence what the
diagram shows.
## References
- [archify](https://github.com/tt-a1i/archify), by tt-a1i, Apache-2.0
licence: an agent skill that draws this kind from typed JSON into an
interactive page; the kind came to this page from it, the picture is
drawn here.
22Breakdown tree: a whole split into its parts
One thing on top, split into its parts, each part into its own, down to the level the question needs. Every part has one parent, so the reader sees what belongs where and what is missing an owner.
Fits when
- A whole and its parts: a product by feature, a system by component, a team by people, a goal by its tasks.
- The question is where each part belongs, and which part has no owner, no test, no plan.
- One parent each: every part sits under exactly one other.
Not when
How it is drawn
- The root: on top, in the middle, a blue box with the whole's name and a count under it (7 parts, 3 teams).
- The parts: a box per part, its name in bold and one fact under it (its owner, its size); one row per level, at most three levels.
- The lines: from the middle of a parent's bottom down, across, and down into each child; square corners, no arrowheads.
- The leaves: evenly across the bottom row; each parent centred over its own.
- What stands out: the part the question is about amber, a line under the tree saying why.
- Now: a blue box under the tree says in one sentence what to do.
References
- archify, by tt-a1i, Apache-2.0 licence: an agent skill that draws this kind from typed JSON into an interactive page; the kind came to this page from it, the picture is drawn here.
# Breakdown tree: a whole split into its parts
One thing on top, split into its parts, each part into its own, down to
the level the question needs. Every part has one parent, so the reader
sees what belongs where and what is missing an owner.
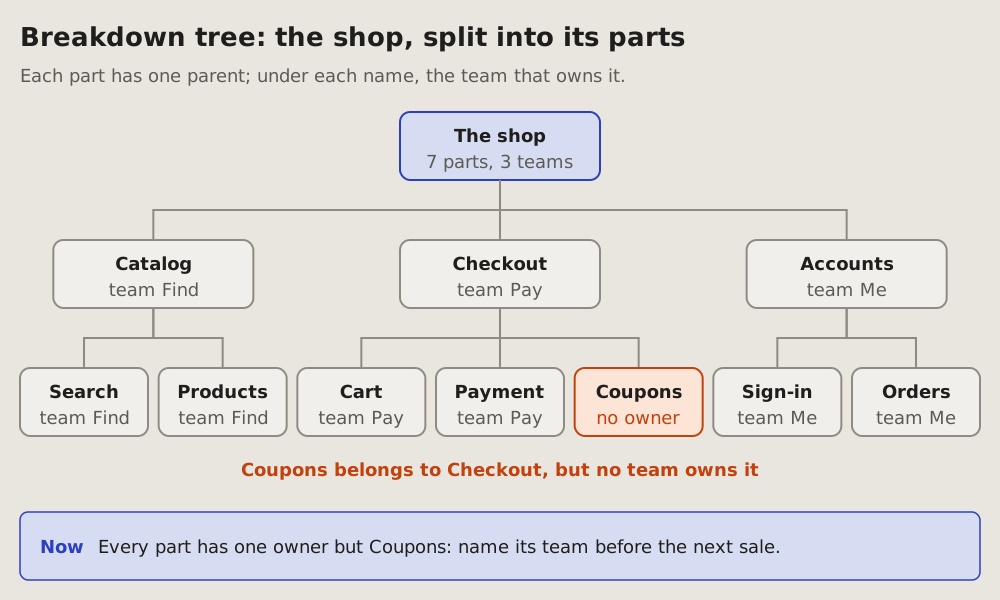
## Fits when
- **A whole and its parts:** a product by feature, a system by component,
a team by people, a goal by its tasks.
- **The question is where each part belongs,** and which part has no
owner, no test, no plan.
- **One parent each:** every part sits under exactly one other.
## Not when
- **A part has two parents,** or the parts call each other: a
[module graph](https://github.com/vbarbarosh/rules/blob/main/diagrams/modules.md) or a [container sketch](https://github.com/vbarbarosh/rules/blob/main/diagrams/containers.md).
- **Files in their folders:** a [module graph](https://github.com/vbarbarosh/rules/blob/main/diagrams/modules.md); what one
change touches, a [change map](https://github.com/vbarbarosh/rules/blob/main/diagrams/changemap.md).
- **How big each part is:** a [treemap](https://github.com/vbarbarosh/rules/blob/main/diagrams/treemap.md), its areas by size.
- **What waits on what:** a [plan graph](https://github.com/vbarbarosh/rules/blob/main/diagrams/plangraph.md).
## How it is drawn
1. **The root:** on top, in the middle, a blue box with the whole's name
and a count under it (7 parts, 3 teams).
2. **The parts:** a box per part, its name in bold and one fact under it
(its owner, its size); one row per level, at most three levels.
3. **The lines:** from the middle of a parent's bottom down, across, and
down into each child; square corners, no arrowheads.
4. **The leaves:** evenly across the bottom row; each parent centred over
its own.
5. **What stands out:** the part the question is about amber, a line
under the tree saying why.
6. **Now:** a blue box under the tree says in one sentence what to do.
## References
- [archify](https://github.com/tt-a1i/archify), by tt-a1i, Apache-2.0
licence: an agent skill that draws this kind from typed JSON into an
interactive page; the kind came to this page from it, the picture is
drawn here.
23Status dashboard: where each part stands
A RAG status dashboard (red, amber, green): the state of many parts at once, each a tile coloured by its state. Big numbers on top, the tiles grouped below, the gaps gathered at the end. Two more kinds at the end: tiles coloured by where each part is, and a whole beside its gap.
Fits when
- The question is where things stand: many parts, each in place, stale or missing.
- The reader must find the gaps fast: a project's checks, a release, an audit of what is covered.
- The same view is read again later, and the colours show what moved.
Not when
- One thing and its states over time: a state diagram.
- What happened in what order: a timeline or a sequence diagram.
- A few parts only: a sentence or a list says it; a dashboard needs enough tiles to scan.
How it is drawn
- The key: green in place and checked, amber stale or unchecked, red missing or failed, in one line under the title.
- KPI cards: three or four big numbers on top, each a word of what it counts and a line of context, coloured like the worst it stands for.
- The status board: a panel per area, its name and a line of what it holds; a tile per part, its name in bold and its state in its colour.
- The gaps: the amber and red tiles again, gathered in a panel at the end, so the reader does not hunt for them.
- Real states only: a tile's word says why it has its colour ("1 failed", "no test"), never just "bad".
Coloured by where it is
When the question is where each part is, not how it is, the colours name places: production, development, the working tree. The list behind a tile opens on a click, in a panel beside the grid.
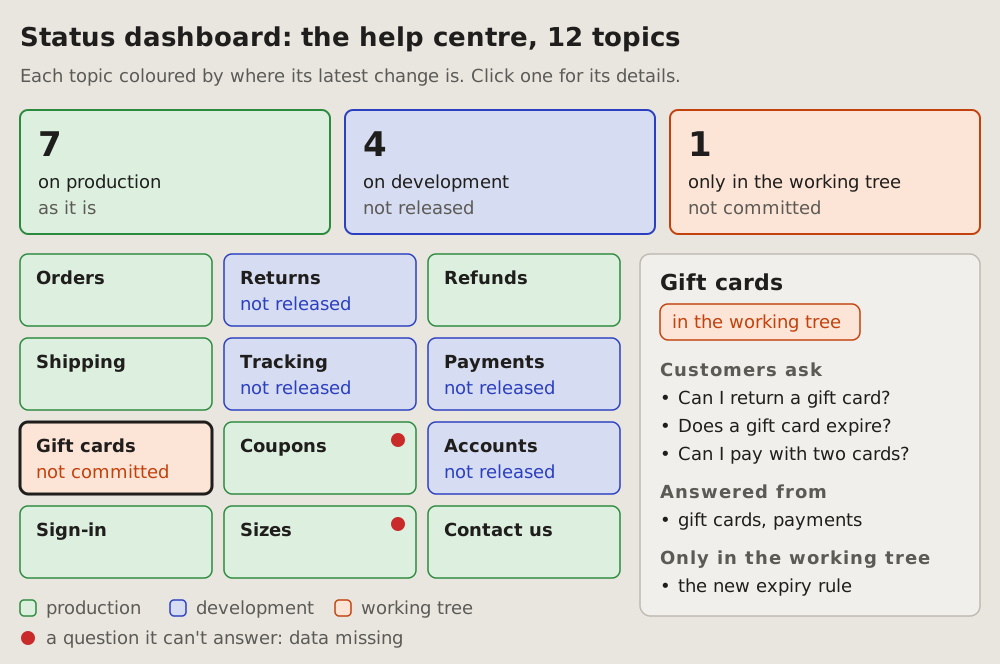
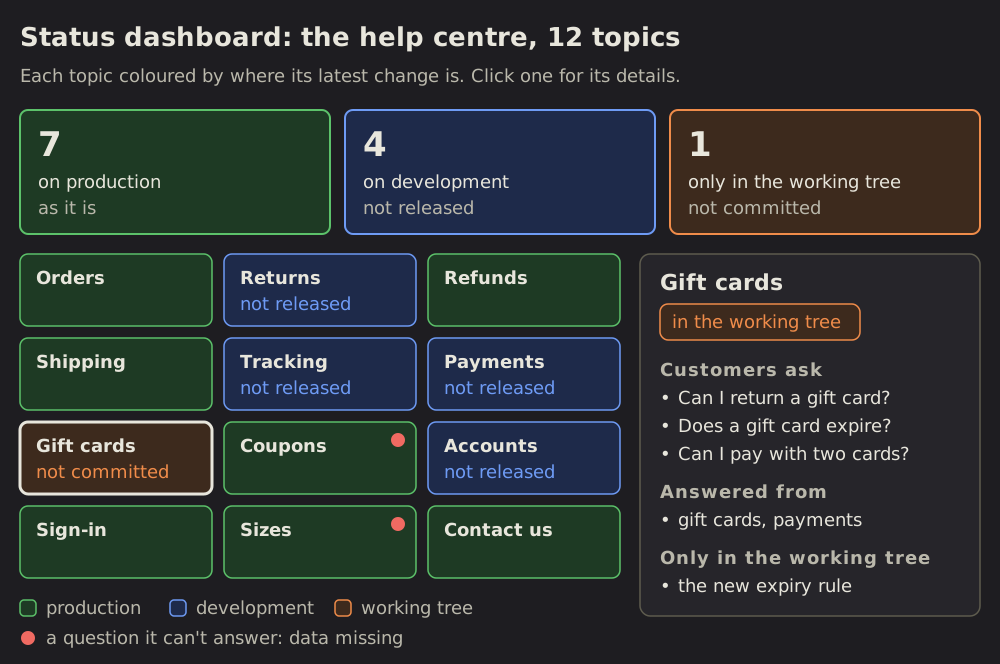
- A card per place, in the colour its tiles get: green, on production as it is; blue, on development and not released; amber, only in the working tree and not committed.
- Each tile in the colour of its latest change: its name in bold, a small word for what is not out yet ("not released").
- A red dot on a tile: a question it cannot answer, its data missing.
- The key under the grid, the red dot in it too.
- Details on a click: the chosen tile gets a dark outline; the panel beside the grid shows its name, a tag of where it is, and short sections, headed in small caps, of a few bullets each. The tile never grows to hold its list.
A whole and its gap
When the question is how much is covered, one bar shows the whole and what is missing from it; a row of squares counts the runs.
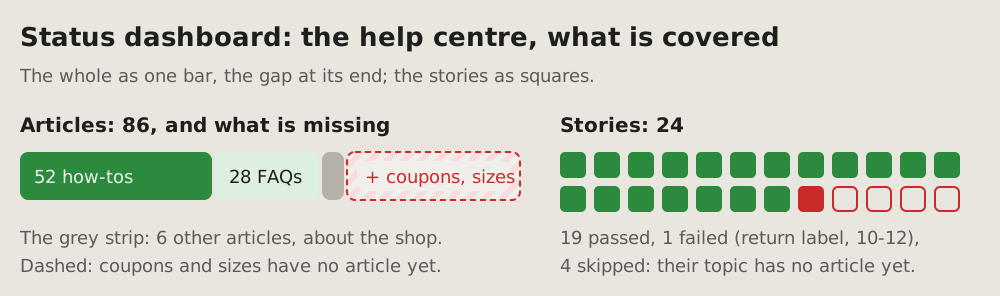
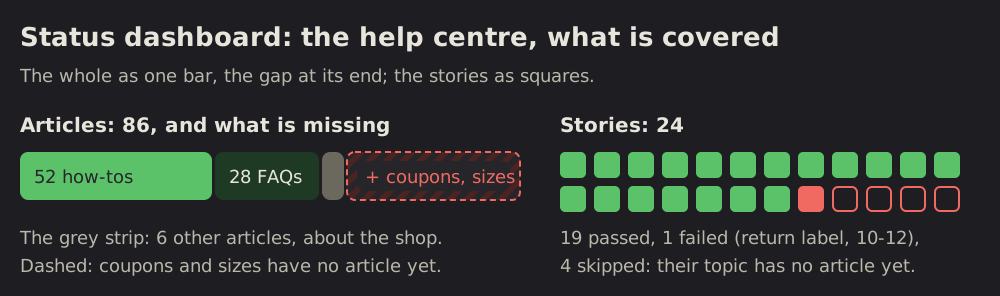
- The bar: a segment per kind, as wide as its count, dark green, light green, a thin strip for the rest.
- The gap: a dashed red segment at the end, hatched soft red, its label on a pill: "+ coupons, sizes".
- A grey line under the bar names the strip and the dashed part.
- Units as squares, in rows: filled green passed, filled red failed, empty with a red outline skipped. A grey line under them says which failed, when, and why the rest were skipped.
# Status dashboard: where each part stands
A RAG status dashboard (red, amber, green): the state of many parts at
once, each a tile coloured by its state. Big numbers on top, the tiles
grouped below, the gaps gathered at the end. Two more kinds at the end:
tiles coloured by where each part is, and a whole beside its gap.
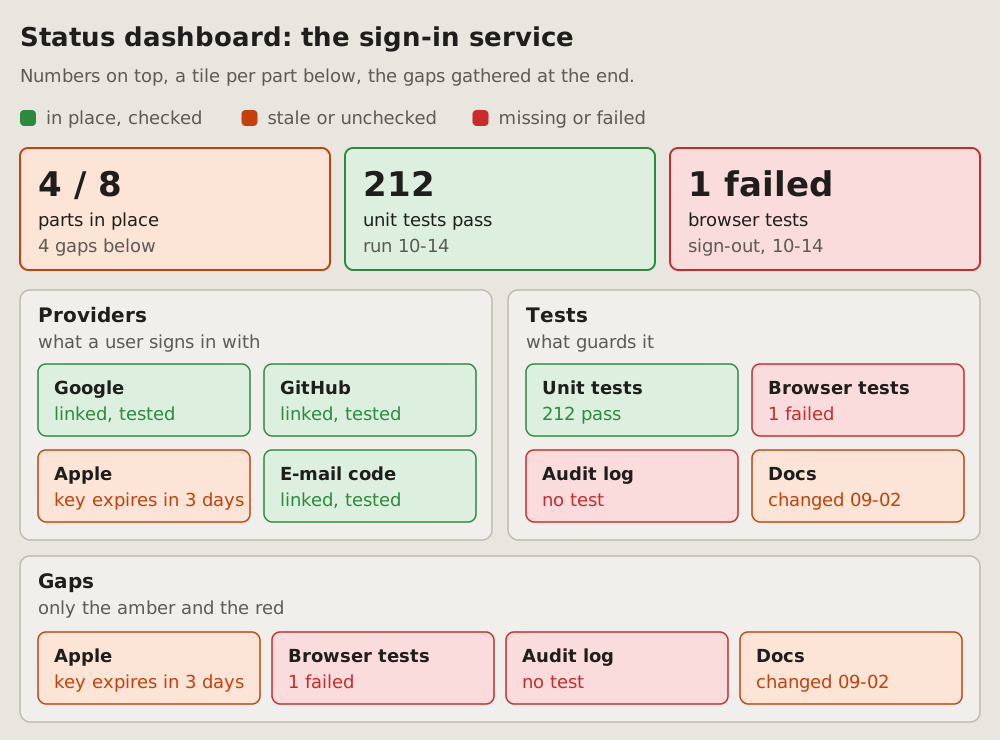
## Fits when
- **The question is where things stand:** many parts, each in place,
stale or missing.
- **The reader must find the gaps fast:** a project's checks, a release,
an audit of what is covered.
- **The same view is read again later,** and the colours show what moved.
## Not when
- **One thing and its states over time:** a [state diagram](https://github.com/vbarbarosh/rules/blob/main/diagrams/state.md).
- **What happened in what order:** a [timeline](https://github.com/vbarbarosh/rules/blob/main/diagrams/timeline.md) or a
[sequence diagram](https://github.com/vbarbarosh/rules/blob/main/diagrams/sequence.md).
- **A few parts only:** a sentence or a list says it; a dashboard needs
enough tiles to scan.
## How it is drawn
1. **The key:** green in place and checked, amber stale or unchecked, red
missing or failed, in one line under the title.
2. **KPI cards:** three or four big numbers on top, each a word of what it
counts and a line of context, coloured like the worst it stands for.
3. **The status board:** a panel per area, its name and a line of what it
holds; a tile per part, its name in bold and its state in its colour.
4. **The gaps:** the amber and red tiles again, gathered in a panel at the
end, so the reader does not hunt for them.
5. **Real states only:** a tile's word says why it has its colour ("1
failed", "no test"), never just "bad".
## Coloured by where it is
When the question is where each part is, not how it is, the colours name
places: production, development, the working tree. The list behind a tile
opens on a click, in a panel beside the grid.
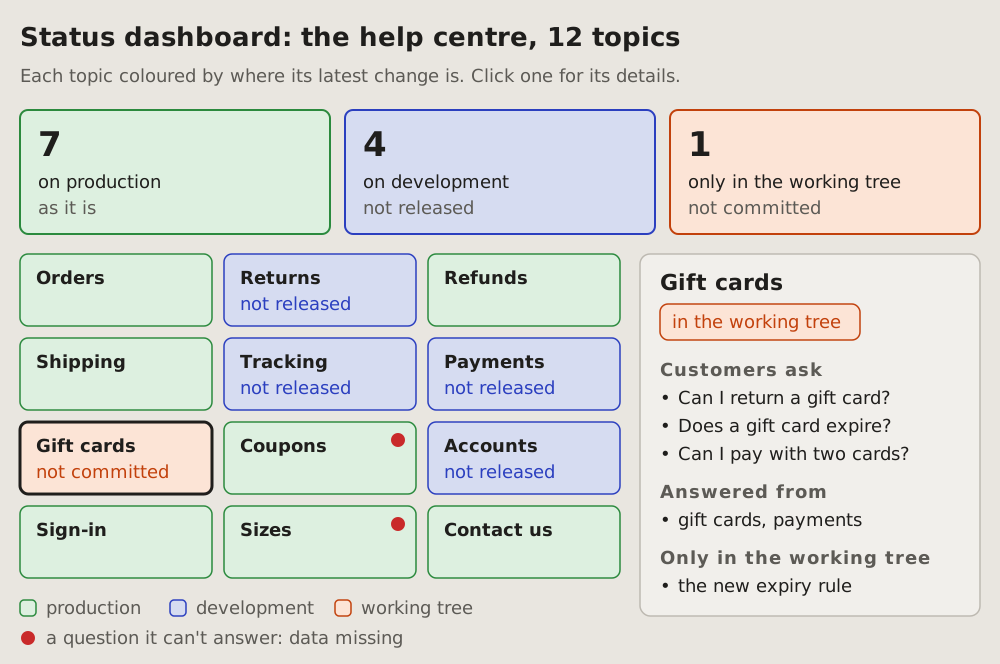
1. **A card per place,** in the colour its tiles get: green, on production
as it is; blue, on development and not released; amber, only in the
working tree and not committed.
2. **Each tile in the colour of its latest change:** its name in bold, a
small word for what is not out yet ("not released").
3. **A red dot** on a tile: a question it cannot answer, its data missing.
4. **The key** under the grid, the red dot in it too.
5. **Details on a click:** the chosen tile gets a dark outline; the panel
beside the grid shows its name, a tag of where it is, and short
sections, headed in small caps, of a few bullets each. The tile never
grows to hold its list.
## A whole and its gap
When the question is how much is covered, one bar shows the whole and
what is missing from it; a row of squares counts the runs.
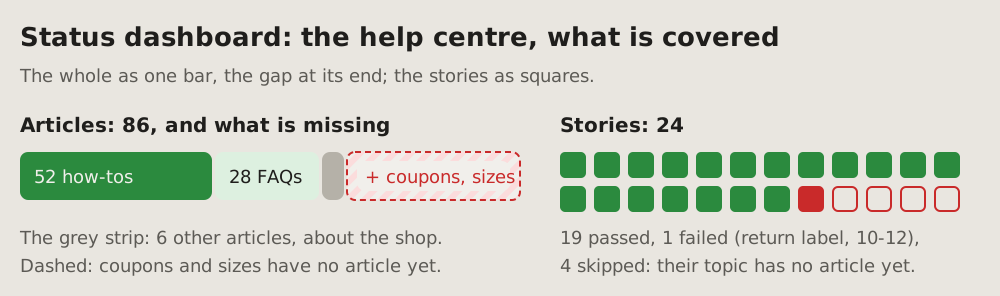
- **The bar:** a segment per kind, as wide as its count, dark green, light
green, a thin strip for the rest.
- **The gap:** a dashed red segment at the end, hatched soft red, its
label on a pill: "+ coupons, sizes".
- **A grey line under the bar** names the strip and the dashed part.
- **Units as squares,** in rows: filled green passed, filled red failed,
empty with a red outline skipped. A grey line under them says which
failed, when, and why the rest were skipped.
24Line chart: a number over time
One number over days or hours, a point for each, joined by a line; a dashed line marks the moment something changed, a deploy or a fix. The reader sees the number before and after, and whether it stayed.
Fits when
- One number, measured again and again: a load time, an error rate, a queue's length; two numbers at most.
- The question is before and after: did the deploy or the fix move the number, and did it stay moved.
- A goal or a limit exists, and the reader sees which side of it the line is on.
Not when
- One run's time by function: a flame graph.
- When something happens by hour and day of the week: a heatmap.
- Work planned over months: a roadmap.
- Events from a log, not a measured number: a timeline.
How it is drawn
- Time: left to right along the bottom, the dates or hours under it, every other one when they crowd; a week to a month of days, or a day of hours.
- The number: up the side from zero, a few round values with their unit ("1 s", "2 s"), a thin line across the panel at each.
- The line: a dot per measurement, joined. Red before the change, green after it when the number improved; one colour when nothing changed.
- The change: a blue dashed line down the panel at its moment, its name and date on a blue pill at the top.
- The goal: a grey dashed line across, its value at the right end; only when there is one.
- What it says: the typical value before and after in the line's colour, next to the line, in a few words.
- Now: a blue box under the panel says in one sentence what changed and by how much.
# Line chart: a number over time
One number over days or hours, a point for each, joined by a line; a
dashed line marks the moment something changed, a deploy or a fix. The
reader sees the number before and after, and whether it stayed.
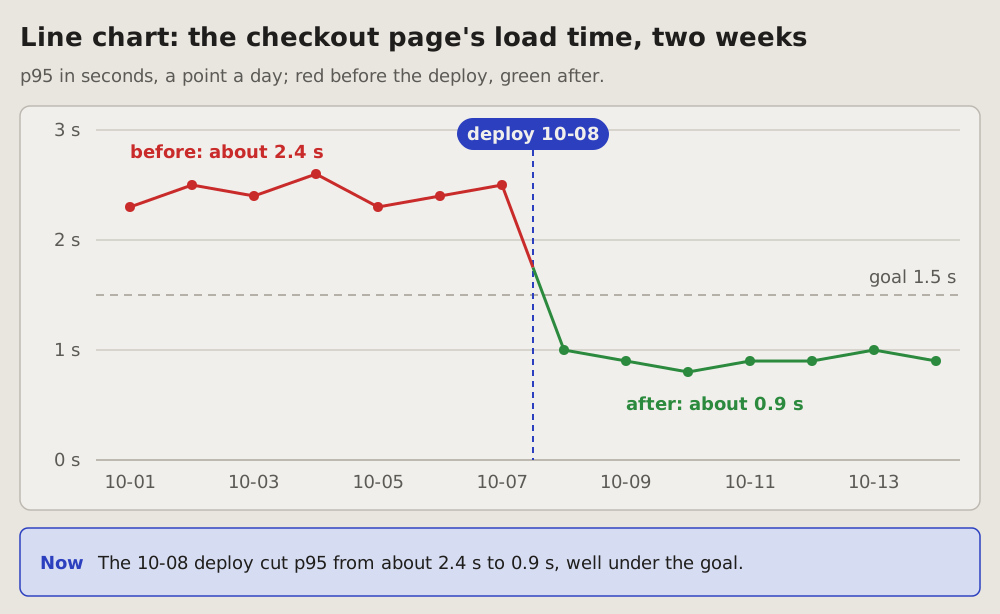
## Fits when
- **One number, measured again and again:** a load time, an error rate,
a queue's length; two numbers at most.
- **The question is before and after:** did the deploy or the fix move
the number, and did it stay moved.
- **A goal or a limit exists,** and the reader sees which side of it the
line is on.
## Not when
- **One run's time by function:** a [flame graph](https://github.com/vbarbarosh/rules/blob/main/diagrams/flame.md).
- **When something happens by hour and day of the week:** a
[heatmap](https://github.com/vbarbarosh/rules/blob/main/diagrams/heatmap.md).
- **Work planned over months:** a [roadmap](https://github.com/vbarbarosh/rules/blob/main/diagrams/roadmap.md).
- **Events from a log,** not a measured number: a
[timeline](https://github.com/vbarbarosh/rules/blob/main/diagrams/timeline.md).
## How it is drawn
1. **Time:** left to right along the bottom, the dates or hours under
it, every other one when they crowd; a week to a month of days, or a
day of hours.
2. **The number:** up the side from zero, a few round values with their
unit ("1 s", "2 s"), a thin line across the panel at each.
3. **The line:** a dot per measurement, joined. Red before the change,
green after it when the number improved; one colour when nothing
changed.
4. **The change:** a blue dashed line down the panel at its moment, its
name and date on a blue pill at the top.
5. **The goal:** a grey dashed line across, its value at the right end;
only when there is one.
6. **What it says:** the typical value before and after in the line's
colour, next to the line, in a few words.
7. **Now:** a blue box under the panel says in one sentence what changed
and by how much.
25Bar chart: how much of each
One bar per thing counted, as long as its count, all from zero, sorted longest first. The reader compares at a glance which is biggest, by how much, and where the one the question is about stands.
Fits when
- A count per kind: errors by cause, sign-ups by source, time by stage; three to ten kinds.
- The question is which is biggest, and by how much it beats the next.
- One of them matters most: the one that is ours to fix, the one that grew.
Not when
- A number over time: a line chart.
- Shares of one whole, where the question is what part of all: a pie chart; with many kinds a bar chart still reads better.
- One whole and its gap, how much is covered: the bar of a dashboard.
- Two or three numbers: say them in a sentence.
How it is drawn
- The bars: across, one per kind, longest on top, the same thickness, blue; the name to the left of each, its count at its end.
- The axis: from zero along the bottom, a few round values and a thin line up the panel at each; a bar never starts above zero.
- The one that matters: amber, its name bold, a few words beside its count (ours to fix).
- The total: under the axis, what is counted and how many in all.
- Now: a blue box under the chart says in one sentence what it shows.
References
- archify, by tt-a1i, Apache-2.0 licence: an agent skill that draws this kind from typed JSON into an interactive page; the kind came to this page from it, the picture is drawn here.
# Bar chart: how much of each
One bar per thing counted, as long as its count, all from zero, sorted
longest first. The reader compares at a glance which is biggest, by how
much, and where the one the question is about stands.
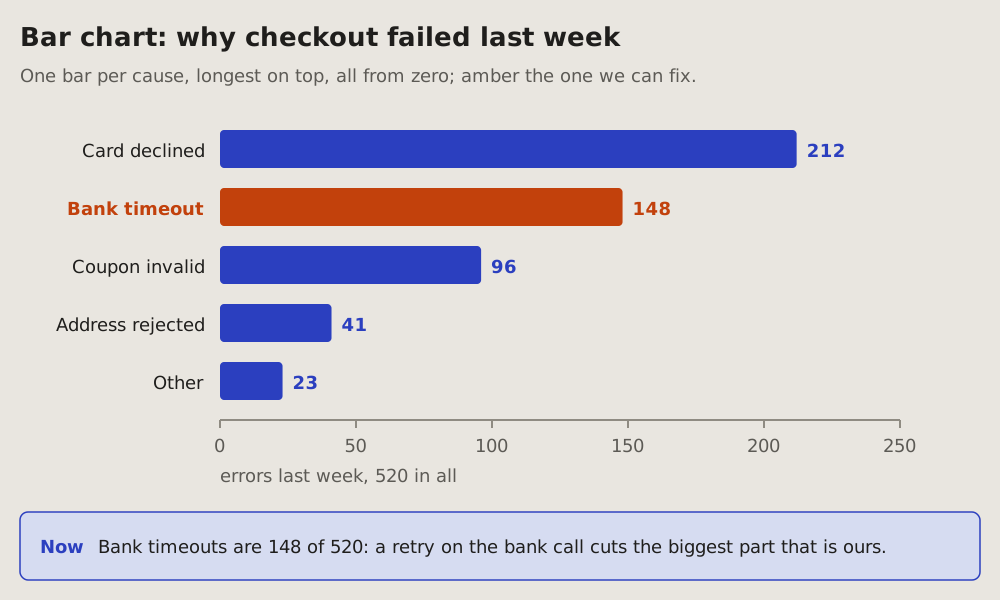
## Fits when
- **A count per kind:** errors by cause, sign-ups by source, time by
stage; three to ten kinds.
- **The question is which is biggest,** and by how much it beats the next.
- **One of them matters most:** the one that is ours to fix, the one that
grew.
## Not when
- **A number over time:** a [line chart](https://github.com/vbarbarosh/rules/blob/main/diagrams/linechart.md).
- **Shares of one whole,** where the question is what part of all: a
[pie chart](https://github.com/vbarbarosh/rules/blob/main/diagrams/piechart.md); with many kinds a bar chart still reads better.
- **One whole and its gap,** how much is covered: the bar of a
[dashboard](https://github.com/vbarbarosh/rules/blob/main/diagrams/dashboard.md).
- **Two or three numbers:** say them in a sentence.
## How it is drawn
1. **The bars:** across, one per kind, longest on top, the same thickness,
blue; the name to the left of each, its count at its end.
2. **The axis:** from zero along the bottom, a few round values and a thin
line up the panel at each; a bar never starts above zero.
3. **The one that matters:** amber, its name bold, a few words beside its
count (ours to fix).
4. **The total:** under the axis, what is counted and how many in all.
5. **Now:** a blue box under the chart says in one sentence what it shows.
## References
- [archify](https://github.com/tt-a1i/archify), by tt-a1i, Apache-2.0
licence: an agent skill that draws this kind from typed JSON into an
interactive page; the kind came to this page from it, the picture is
drawn here.
26Pie chart: shares of one whole
One whole cut into its shares: a ring, each slice as big as its share, the biggest from the top clockwise, the total in the middle. The reader sees what part of all each share is, and whether one is most of it.
Fits when
- The parts add up to a whole: visits by source, a budget by item, time by kind of work.
- The question is what part of all: almost half, a quarter, a sliver.
- Two to five shares; the rest merged into one grey "other".
Not when
- The shares are close, or the question is which is bigger by how much: a bar chart; slices that differ a little look the same.
- More than five shares, or parts that do not add up to one whole: a bar chart.
- A share over time: a line chart.
- Where it goes, step by step: a sankey.
How it is drawn
- The ring: a pie with a hole, the total in bold in the hole and what it counts under it.
- The slices: the biggest from the top, clockwise, then smaller; blue, green, amber, purple, and "other" grey and last. A thin gap of the background between slices.
- The legend: beside the ring, in the slices' order: a swatch, the name, the share in its colour, the count in grey.
- Now: a blue box under the chart says in one sentence what it shows.
References
- archify, by tt-a1i, Apache-2.0 licence: an agent skill that draws this kind from typed JSON into an interactive page; the kind came to this page from it, the picture is drawn here.
# Pie chart: shares of one whole
One whole cut into its shares: a ring, each slice as big as its share,
the biggest from the top clockwise, the total in the middle. The reader
sees what part of all each share is, and whether one is most of it.
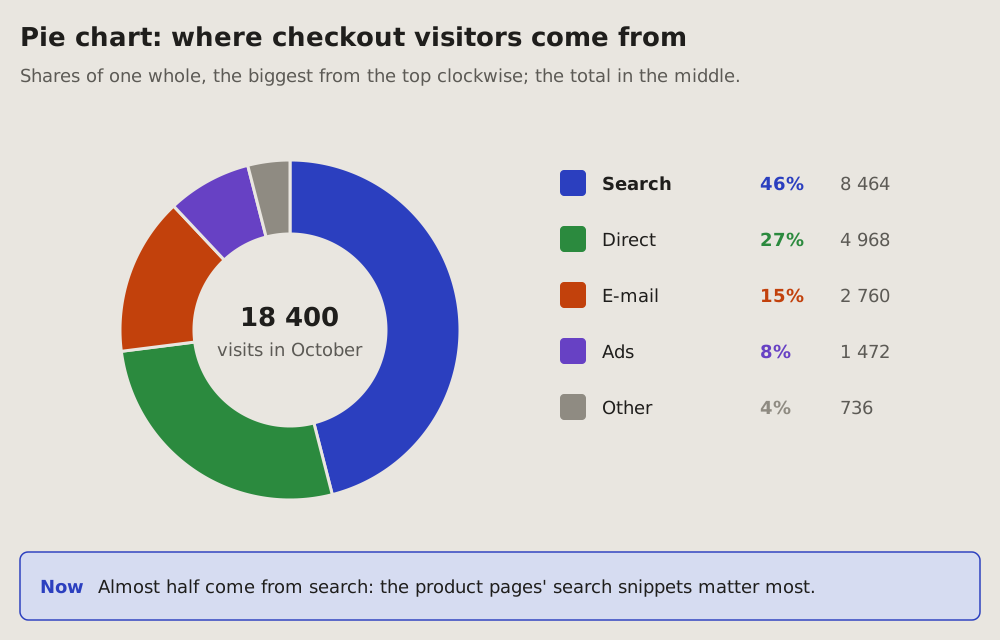
## Fits when
- **The parts add up to a whole:** visits by source, a budget by item,
time by kind of work.
- **The question is what part of all:** almost half, a quarter, a sliver.
- **Two to five shares;** the rest merged into one grey "other".
## Not when
- **The shares are close,** or the question is which is bigger by how
much: a [bar chart](https://github.com/vbarbarosh/rules/blob/main/diagrams/barchart.md); slices that differ a little look the
same.
- **More than five shares,** or parts that do not add up to one whole: a
[bar chart](https://github.com/vbarbarosh/rules/blob/main/diagrams/barchart.md).
- **A share over time:** a [line chart](https://github.com/vbarbarosh/rules/blob/main/diagrams/linechart.md).
- **Where it goes, step by step:** a [sankey](https://github.com/vbarbarosh/rules/blob/main/diagrams/sankey.md).
## How it is drawn
1. **The ring:** a pie with a hole, the total in bold in the hole and what
it counts under it.
2. **The slices:** the biggest from the top, clockwise, then smaller; blue,
green, amber, purple, and "other" grey and last. A thin gap of the
background between slices.
3. **The legend:** beside the ring, in the slices' order: a swatch, the
name, the share in its colour, the count in grey.
4. **Now:** a blue box under the chart says in one sentence what it shows.
## References
- [archify](https://github.com/tt-a1i/archify), by tt-a1i, Apache-2.0
licence: an agent skill that draws this kind from typed JSON into an
interactive page; the kind came to this page from it, the picture is
drawn here.
27Heatmap: when it happens
A week in one grid: the days as rows, the hours as columns, each cell as dark as its count. The reader sees at once which hours of which days pile up, and which stay quiet.
Fits when
- Many events, and the question is when: which hours of which days they come at.
- A pattern repeats by the day of the week or the hour of the day, and a line of time would hide it.
- One spot stands out, and its days and hours point at a cause: a job that runs late, a peak of visitors, a weekly report.
Not when
How it is drawn
- The grid: in one framed panel, a row per day from Monday to Sunday, its name in bold on the left; a column per hour, or per two hours, its start on top.
- The cells: one per day and hour, as dark as its count: grey for none, then pale to dark amber; five or six steps in all.
- The scale: on the line under the title, a swatch per step with its range, from none to the darkest.
- The hot spot: a blue frame around its cells, their counts inside them; under the grid, in blue, its days, its hours and its share of the whole.
- Now: a blue box under the panel says in one sentence when most of it happens and why.
# Heatmap: when it happens
A week in one grid: the days as rows, the hours as columns, each cell as
dark as its count. The reader sees at once which hours of which days
pile up, and which stay quiet.
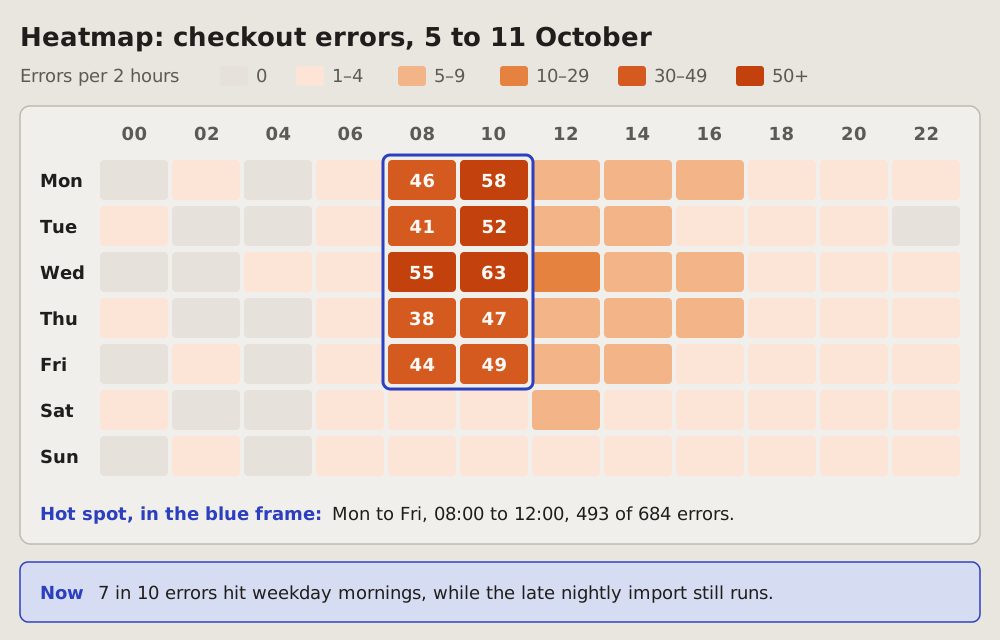
## Fits when
- **Many events, and the question is when:** which hours of which days
they come at.
- **A pattern repeats** by the day of the week or the hour of the day,
and a line of time would hide it.
- **One spot stands out,** and its days and hours point at a cause: a
job that runs late, a peak of visitors, a weekly report.
## Not when
- **One number over time,** going up or down: a
[line chart](https://github.com/vbarbarosh/rules/blob/main/diagrams/linechart.md).
- **Events in their order,** each with its moment: a
[timeline](https://github.com/vbarbarosh/rules/blob/main/diagrams/timeline.md).
- **Parts and their health,** not the hours: a
[status dashboard](https://github.com/vbarbarosh/rules/blob/main/diagrams/dashboard.md).
## How it is drawn
1. **The grid:** in one framed panel, a row per day from Monday to
Sunday, its name in bold on the left; a column per hour, or per two
hours, its start on top.
2. **The cells:** one per day and hour, as dark as its count: grey for
none, then pale to dark amber; five or six steps in all.
3. **The scale:** on the line under the title, a swatch per step with
its range, from none to the darkest.
4. **The hot spot:** a blue frame around its cells, their counts inside
them; under the grid, in blue, its days, its hours and its share of
the whole.
5. **Now:** a blue box under the panel says in one sentence when most of
it happens and why.
28Versions: which version runs where
A table of what is deployed: one row per part, its version, its commit and its date, and whether it is the latest. A verdict in a sentence on top, what "latest" means at the bottom.
Fits when
- The question is what runs now: before a release, after an incident, when a fix should already be live.
- Some parts are deployed by hand, and the reader must see which of them no one can vouch for.
- Many parts, each with its own version, too many to keep in mind.
Not when
How it is drawn
- The time it was read, under the title: a version table is true only for the moment it was taken.
- The verdict first: one sentence, its first half in bold, says what the table shows before the reader reads a row.
- A row per deployed part: its name in bold, the version big and bold, the commit in the look of a link, the date.
- Latest or not: a green tick and "latest", or an amber "? unknown"; never a guess. A grey note says why: "nothing on main is left out", or how it was deployed and the newest code there is.
- What "latest" means, in a line under the table, and where it was read from.
- The reader on top, agents below: the summary first; the sources of every version, the files and logs it was read from, go under a line, in a part of their own for agents.
# Versions: which version runs where
A table of what is deployed: one row per part, its version, its commit
and its date, and whether it is the latest. A verdict in a sentence on
top, what "latest" means at the bottom.
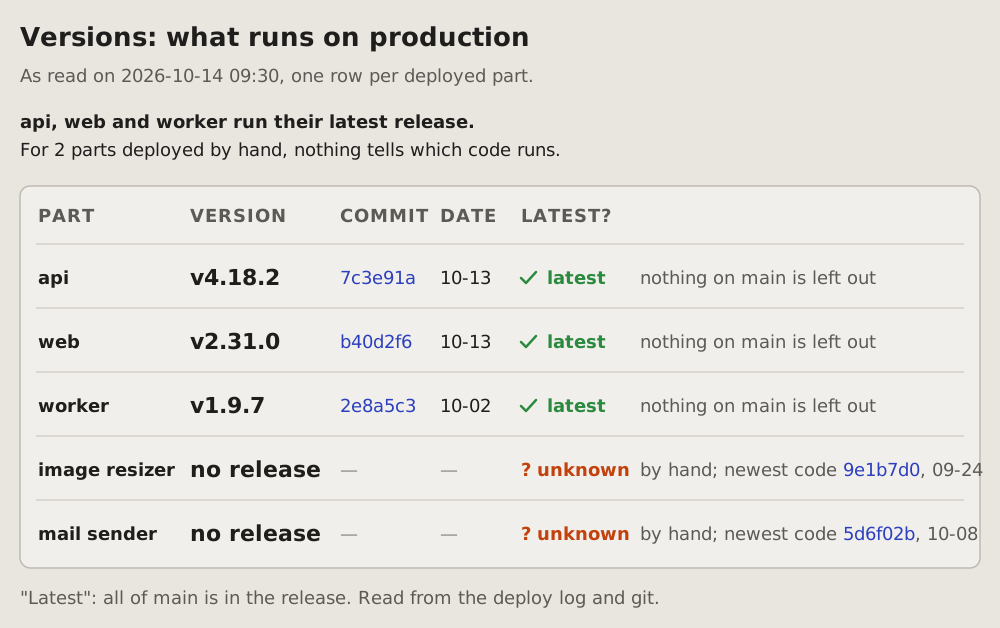
## Fits when
- **The question is what runs now:** before a release, after an
incident, when a fix should already be live.
- **Some parts are deployed by hand,** and the reader must see which of
them no one can vouch for.
- **Many parts, each with its own version,** too many to keep in mind.
## Not when
- **How the parts talk to each other:** a
[containers diagram](https://github.com/vbarbarosh/rules/blob/main/diagrams/containers.md).
- **Where the parts run:** a [cloud diagram](https://github.com/vbarbarosh/rules/blob/main/diagrams/cloud.md).
- **How healthy they are now:** a [service map](https://github.com/vbarbarosh/rules/blob/main/diagrams/servicemap.md) or a
[status dashboard](https://github.com/vbarbarosh/rules/blob/main/diagrams/dashboard.md).
## How it is drawn
1. **The time it was read,** under the title: a version table is true
only for the moment it was taken.
2. **The verdict first:** one sentence, its first half in bold, says
what the table shows before the reader reads a row.
3. **A row per deployed part:** its name in bold, the version big and
bold, the commit in the look of a link, the date.
4. **Latest or not:** a green tick and "latest", or an amber
"? unknown"; never a guess. A grey note says why: "nothing on main is
left out", or how it was deployed and the newest code there is.
5. **What "latest" means,** in a line under the table, and where it was
read from.
6. **The reader on top, agents below:** the summary first; the
sources of every version, the files and logs it was read from, go
under a line, in a part of their own for agents.
29Cloud architecture diagram: what runs where
The parts of a system inside the places they run: the internet, a CDN's edge, a cloud region, its network and subnets, the managed services beside it. Each part an icon with its name, the links as arrows.
Fits when
- The question is where: which region, which network, which subnet a part runs in, and what is managed by the cloud.
- A link crosses a boundary: from the internet into the network, out to an outside service.
- A design review or a newcomer needs the whole system on one page.
Not when
How it is drawn
- The places: nested dashed frames, each named inside at its top left: the internet, the edge, the region, the network, the subnets.
- Parts: a small icon over the name and one line of what it is.
- Links: the project's arrows, coloured by kind (requests blue, data green, background jobs orange), a few words on the long ones.
# Cloud architecture diagram: what runs where
The parts of a system inside the places they run: the internet, a CDN's
edge, a cloud region, its network and subnets, the managed services
beside it. Each part an icon with its name, the links as arrows.
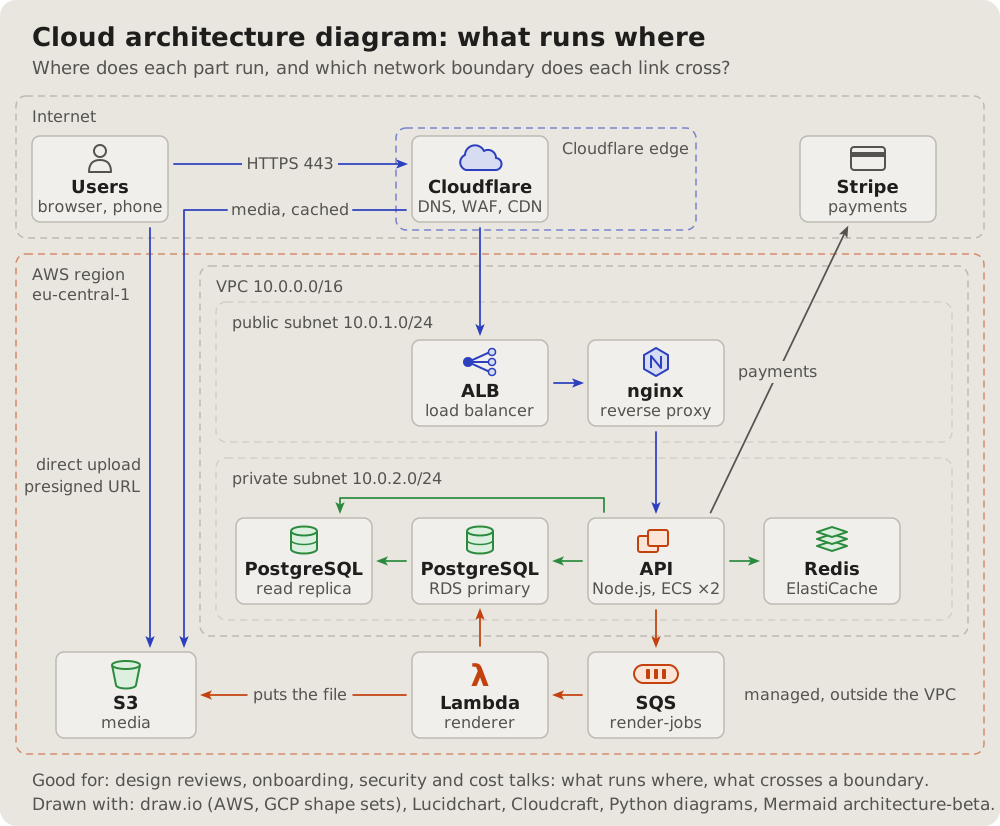
## Fits when
- **The question is where:** which region, which network, which subnet a
part runs in, and what is managed by the cloud.
- **A link crosses a boundary:** from the internet into the network, out
to an outside service.
- **A design review or a newcomer** needs the whole system on one page.
## Not when
- **What each part does** matters more than where: a
[C4 container diagram](https://github.com/vbarbarosh/rules/blob/main/diagrams/containers.md).
- **Ports and who may connect:** a [network diagram](https://github.com/vbarbarosh/rules/blob/main/diagrams/network.md).
- **The order of the calls:** a [sequence diagram](https://github.com/vbarbarosh/rules/blob/main/diagrams/sequence.md).
## How it is drawn
1. **The places:** nested dashed frames, each named inside at its top
left: the internet, the edge, the region, the network, the subnets.
2. **Parts:** a small icon over the name and one line of what it is.
3. **Links:** the project's arrows, coloured by kind (requests blue,
data green, background jobs orange), a few words on the long ones.
30Network diagram: addresses, ports, who may connect
The network engineer's view: address ranges as bands, the gateways at their borders, a security group around what it guards with what it lets in, every link with its protocol and port.
Fits when
- "Why can't X reach Y?": a port, a rule or a subnet in the way.
- A firewall or security-group review: what is open, from where.
- Addresses matter: ranges, gateways, what has a public address.
Not when
How it is drawn
- Bands: each subnet a filled band with its name and range.
- Guards: a security group a dashed outline around what it guards, its rule on the outline ("5432 from sg-api").
- Links: every arrow with its protocol and port on a pill.
# Network diagram: addresses, ports, who may connect
The network engineer's view: address ranges as bands, the gateways at
their borders, a security group around what it guards with what it lets
in, every link with its protocol and port.
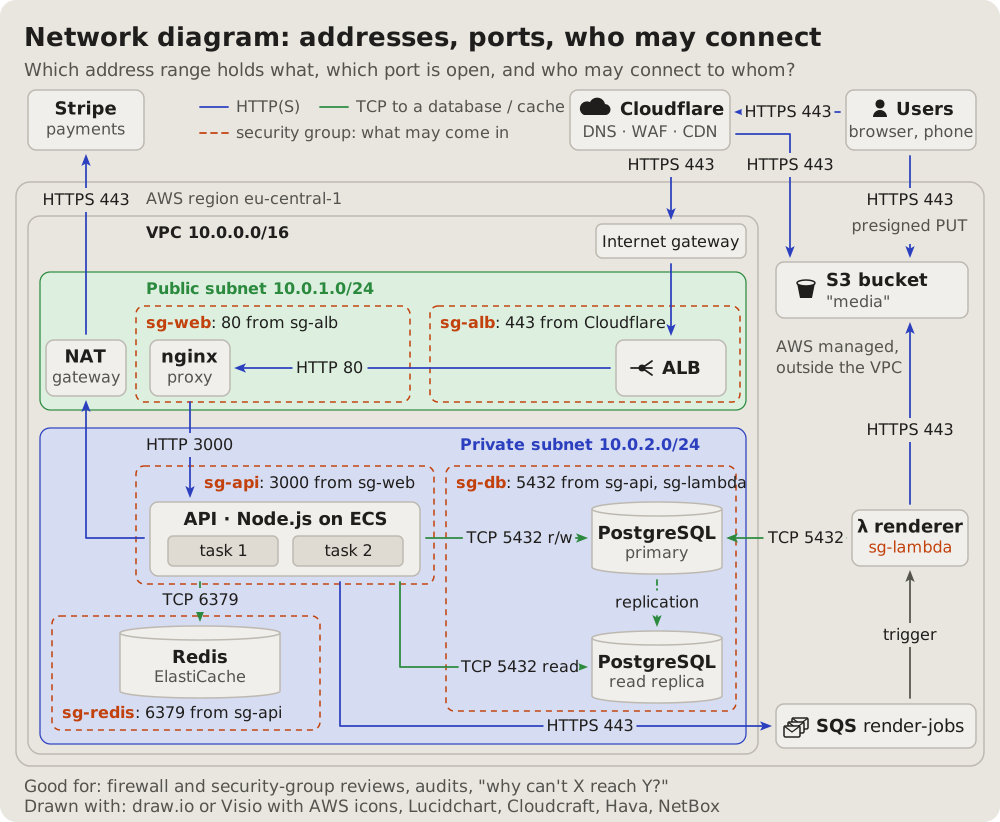
## Fits when
- **"Why can't X reach Y?":** a port, a rule or a subnet in the way.
- **A firewall or security-group review:** what is open, from where.
- **Addresses matter:** ranges, gateways, what has a public address.
## Not when
- **What each part does:** a [C4 container diagram](https://github.com/vbarbarosh/rules/blob/main/diagrams/containers.md).
- **What data crosses where, for a threat model:** a
[data flow diagram](https://github.com/vbarbarosh/rules/blob/main/diagrams/dataflow.md).
## How it is drawn
1. **Bands:** each subnet a filled band with its name and range.
2. **Guards:** a security group a dashed outline around what it guards,
its rule on the outline ("5432 from sg-api").
3. **Links:** every arrow with its protocol and port on a pill.
31Layered diagram: the tiers a request passes
The parts in columns by tier, left to right in the order a request meets them: the edge, the entry, the compute, the background work, the data. The main path bold, the side paths in their own style.
Fits when
- How deep a request goes: which tiers it crosses before an answer.
- Where a part belongs: a new service placed in its tier, or one in the wrong one.
- A caching or scaling talk: what each tier absorbs.
Not when
How it is drawn
- Tiers: columns with a name and a line under it, left to right.
- Parts: boxes in their tier; outside parties outside the columns.
- Paths: the main one bold blue, the background one dashed green, the rest thin grey; a key under the drawing.
# Layered diagram: the tiers a request passes
The parts in columns by tier, left to right in the order a request meets
them: the edge, the entry, the compute, the background work, the data.
The main path bold, the side paths in their own style.
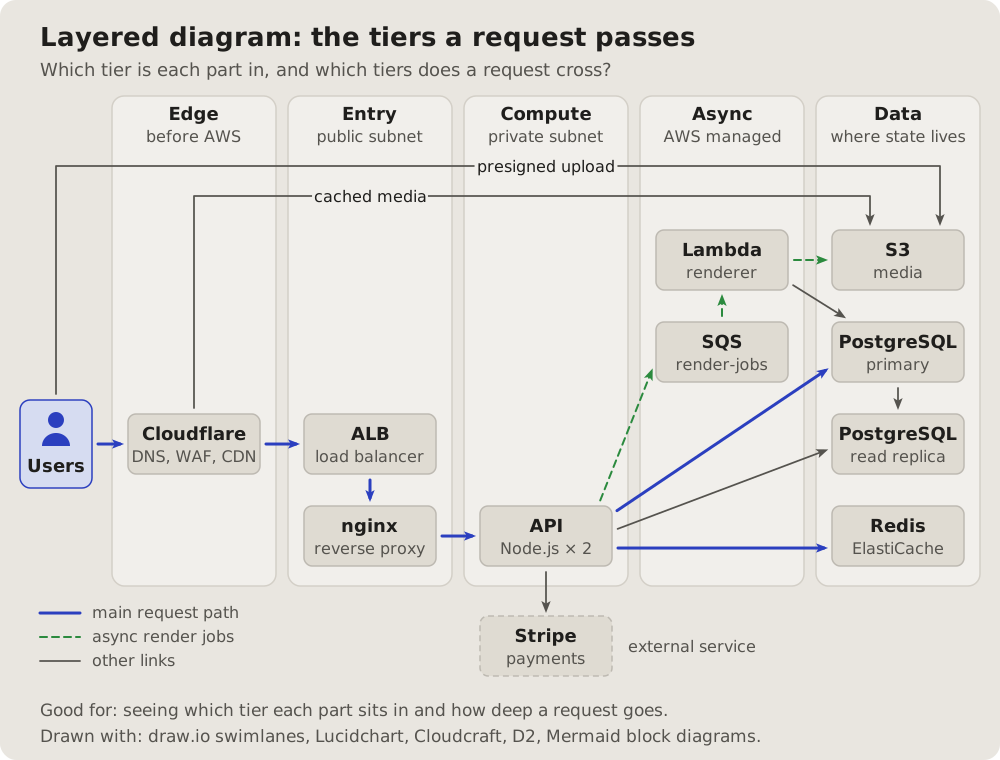
## Fits when
- **How deep a request goes:** which tiers it crosses before an answer.
- **Where a part belongs:** a new service placed in its tier, or one in
the wrong one.
- **A caching or scaling talk:** what each tier absorbs.
## Not when
- **Where things run, in which network:** a
[cloud architecture diagram](https://github.com/vbarbarosh/rules/blob/main/diagrams/cloud.md).
- **Many links between many parts:** a [dependency matrix](https://github.com/vbarbarosh/rules/blob/main/diagrams/matrix.md).
## How it is drawn
1. **Tiers:** columns with a name and a line under it, left to right.
2. **Parts:** boxes in their tier; outside parties outside the columns.
3. **Paths:** the main one bold blue, the background one dashed green, the
rest thin grey; a key under the drawing.
32Isometric diagram: the system as a model
The same parts as blocks on an isometric floor, the networks as raised platforms, the main paths along the grid: a picture to point at on a slide, read before any word.
Fits when
- A slide or a talk: the whole system at once, for people who will not read a diagram's notation.
- Groups matter more than links: what sits together on which platform.
Not when
- Exact links, ports or order: any other kind says it better; an isometric picture hides lines behind blocks.
- The picture will change often: the layout is slow to redraw.
How it is drawn
- The floor: a faint isometric grid; places as dashed outlines on it.
- Platforms: a raised slab per network, its name on a pill.
- Parts: blocks for services, cylinders for stores, a name on a pill.
- Paths: only the main ones, along the grid, coloured by kind.
# Isometric diagram: the system as a model
The same parts as blocks on an isometric floor, the networks as raised
platforms, the main paths along the grid: a picture to point at on a
slide, read before any word.
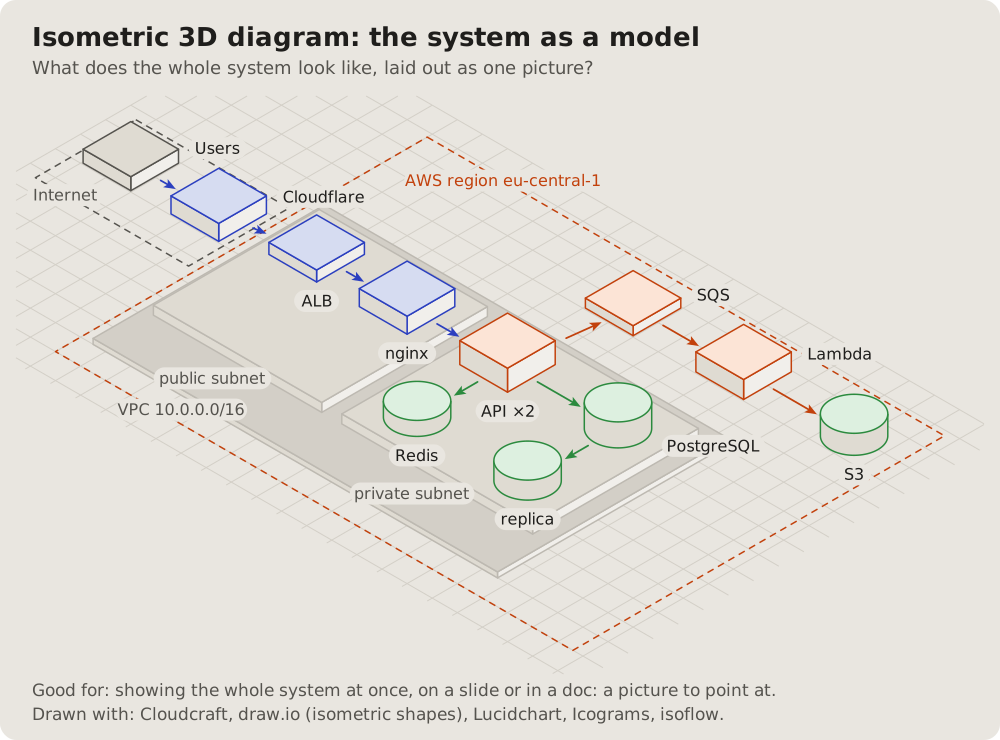
## Fits when
- **A slide or a talk:** the whole system at once, for people who will
not read a diagram's notation.
- **Groups matter more than links:** what sits together on which
platform.
## Not when
- **Exact links, ports or order:** any other kind says it better; an
isometric picture hides lines behind blocks.
- **The picture will change often:** the layout is slow to redraw.
## How it is drawn
1. **The floor:** a faint isometric grid; places as dashed outlines on it.
2. **Platforms:** a raised slab per network, its name on a pill.
3. **Parts:** blocks for services, cylinders for stores, a name on a pill.
4. **Paths:** only the main ones, along the grid, coloured by kind.
33Service map: what talks to what, live
What a tracing tool draws from real traffic: each service a circle with a ring for its health, each link as thick as its traffic, the numbers on the links. The unwell one stands out at a glance.
Fits when
- On call: which hop is slow or failing, and who depends on it.
- Traffic matters: where the requests go, how many.
- The real system, as measured, not as designed.
Not when
How it is drawn
- Services: circles laid out freely, an icon inside, the name and one number under it.
- Health: the ring green, orange when slow, red when failing, dashed grey for what is not traced.
- Links: thickness by traffic, "N req/s" on a pill; a legend.
# Service map: what talks to what, live
What a tracing tool draws from real traffic: each service a circle with a
ring for its health, each link as thick as its traffic, the numbers on the
links. The unwell one stands out at a glance.
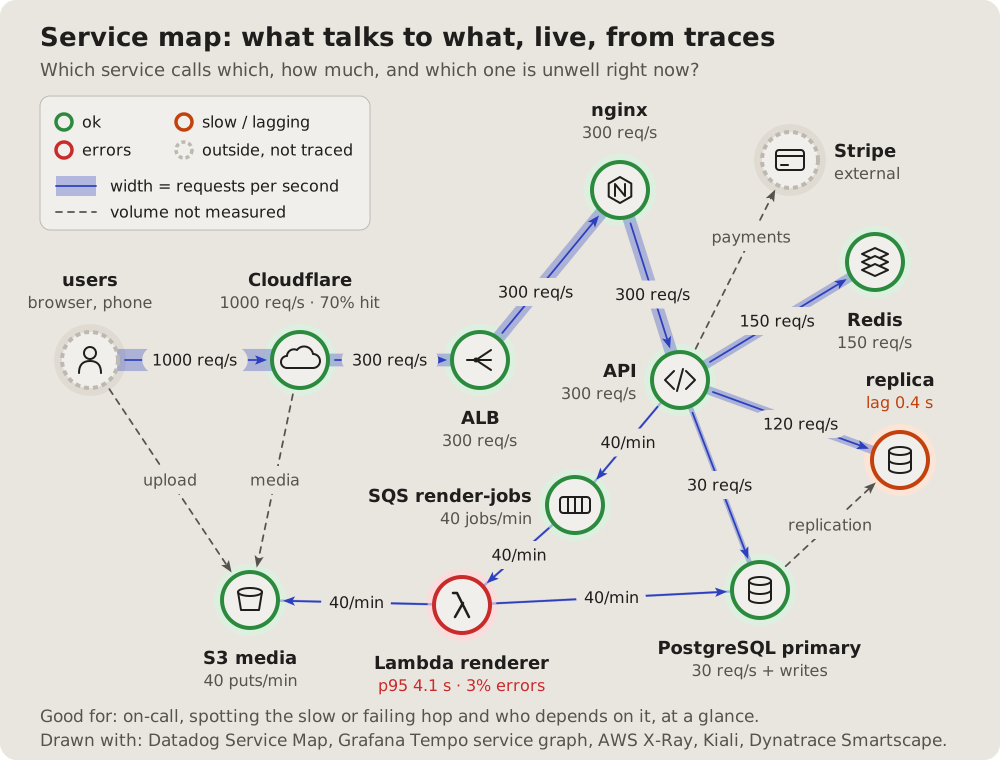
## Fits when
- **On call:** which hop is slow or failing, and who depends on it.
- **Traffic matters:** where the requests go, how many.
- **The real system,** as measured, not as designed.
## Not when
- **The design, before it runs:** a
[C4 container diagram](https://github.com/vbarbarosh/rules/blob/main/diagrams/containers.md).
- **How much of the traffic stops where:** a [Sankey diagram](https://github.com/vbarbarosh/rules/blob/main/diagrams/sankey.md).
## How it is drawn
1. **Services:** circles laid out freely, an icon inside, the name and one
number under it.
2. **Health:** the ring green, orange when slow, red when failing, dashed
grey for what is not traced.
3. **Links:** thickness by traffic, "N req/s" on a pill; a legend.
34Sankey diagram: where the traffic goes, how much
Traffic as bands that split and end, each as wide as its share: what a cache absorbs, what reaches each part behind it.
Fits when
- Capacity and cost: how much each layer absorbs and passes on.
- A cache's worth: the share that never reaches the origin.
Not when
How it is drawn
- Columns: a thin bar per part, its name above.
- Bands: from bar to bar, widths to one scale, each with its number.
- Ends: what stops early ends at its own bar, in its own colour.
# Sankey diagram: where the traffic goes, how much
Traffic as bands that split and end, each as wide as its share: what a
cache absorbs, what reaches each part behind it.
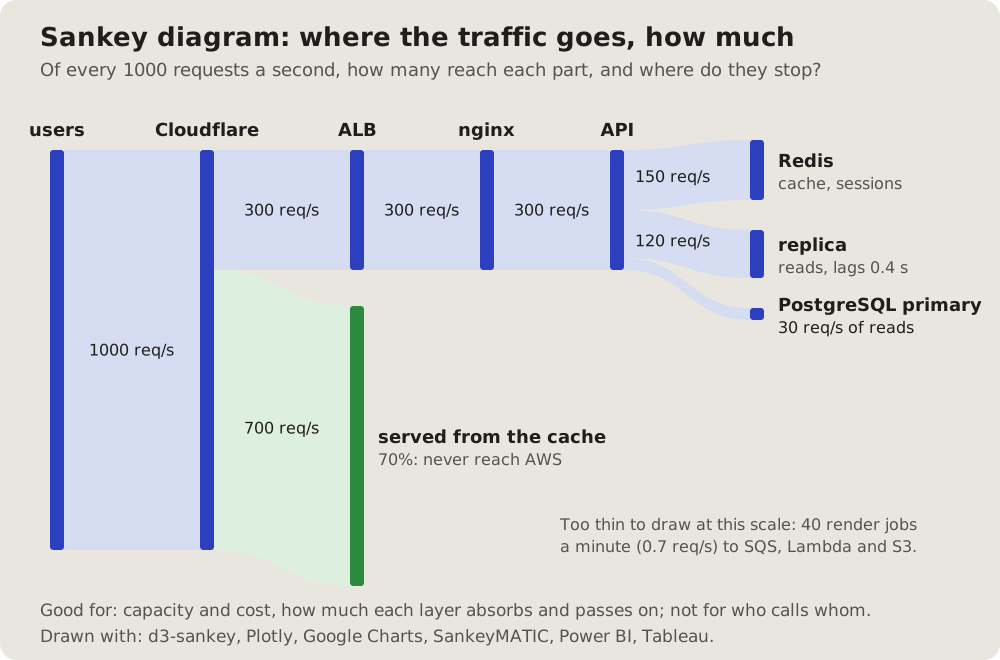
## Fits when
- **Capacity and cost:** how much each layer absorbs and passes on.
- **A cache's worth:** the share that never reaches the origin.
## Not when
- **Who calls whom:** a [service map](https://github.com/vbarbarosh/rules/blob/main/diagrams/servicemap.md) or a
[layered diagram](https://github.com/vbarbarosh/rules/blob/main/diagrams/tiers.md).
- **Flows too small to see** beside big ones: say them in a line under it.
## How it is drawn
1. **Columns:** a thin bar per part, its name above.
2. **Bands:** from bar to bar, widths to one scale, each with its number.
3. **Ends:** what stops early ends at its own bar, in its own colour.
35Trace waterfall: where one request spends its time
One request traced across services: a row per span, each a bar from its start to its end on one scale of milliseconds, a called span indented under its caller. The reader sees the slowest span, what runs in turn, and the gaps where the request only waits.
Fits when
- "Why is this request slow?": one request, measured across the services it passes.
- Calls in turn or at once: the reader sees what waits for what, and what could run side by side.
- Time lost between spans: a gap where nothing runs is as plain as the work.
Not when
How it is drawn
- Time: milliseconds left to right in one framed panel, the ticks on top, faint dashed lines down from them; zero is the request's start.
- Rows: one per span in the order it starts, the service in bold and what it did after it; a called span indented under its caller.
- Milliseconds: each span's time in a column right before its bar, so the numbers read down one line.
- Bars: one per span from its start to its end, to one scale; a few milliseconds still get a thin bar. The slowest span is solid red, its name and time in red.
- Waits: a gap where no span runs is an amber band behind the rows, its length on an amber pill under them.
- Now: a blue box under the panel says in one sentence where the time goes.
# Trace waterfall: where one request spends its time
One request traced across services: a row per span, each a bar from its
start to its end on one scale of milliseconds, a called span indented
under its caller. The reader sees the slowest span, what runs in turn,
and the gaps where the request only waits.
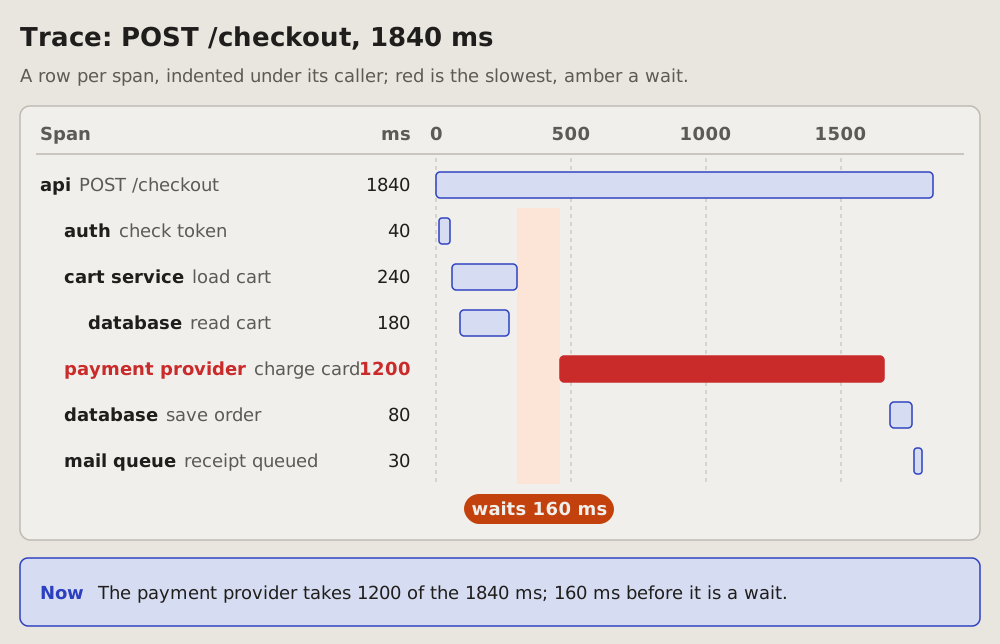
## Fits when
- **"Why is this request slow?":** one request, measured across the
services it passes.
- **Calls in turn or at once:** the reader sees what waits for what, and
what could run side by side.
- **Time lost between spans:** a gap where nothing runs is as plain as
the work.
## Not when
- **The call stacks of one process,** by function: a
[flame graph](https://github.com/vbarbarosh/rules/blob/main/diagrams/flame.md).
- **Who talks to whom,** in order, with the messages: a
[sequence diagram](https://github.com/vbarbarosh/rules/blob/main/diagrams/sequence.md).
- **A number over time,** many requests: a [line chart](https://github.com/vbarbarosh/rules/blob/main/diagrams/linechart.md).
## How it is drawn
1. **Time:** milliseconds left to right in one framed panel, the ticks
on top, faint dashed lines down from them; zero is the request's
start.
2. **Rows:** one per span in the order it starts, the service in bold
and what it did after it; a called span indented under its caller.
3. **Milliseconds:** each span's time in a column right before its bar,
so the numbers read down one line.
4. **Bars:** one per span from its start to its end, to one scale; a
few milliseconds still get a thin bar. The slowest span is solid red,
its name and time in red.
5. **Waits:** a gap where no span runs is an amber band behind the rows,
its length on an amber pill under them.
6. **Now:** a blue box under the panel says in one sentence where the
time goes.
36Data flow diagram: where data crosses a trust boundary
The threat modeller's view: outside parties, processes and data stores, the flows between them labelled with the data they carry, and the trust boundaries as red dashed lines. Each crossing gets a number to discuss.
Fits when
- A security review or a threat model: each crossing is a place to ask what can go wrong (STRIDE per crossing).
- Privacy: where personal data goes and what leaves.
Not when
How it is drawn
- Notation: outside parties as boxes, processes as circles, stores as two open lines; a key.
- Flows: arrows named by their data ("card token"), not by protocol.
- Boundaries: red dashed lines; a numbered badge where a flow crosses one, the risky ones noted under the drawing.
# Data flow diagram: where data crosses a trust boundary
The threat modeller's view: outside parties, processes and data stores,
the flows between them labelled with the data they carry, and the trust
boundaries as red dashed lines. Each crossing gets a number to discuss.
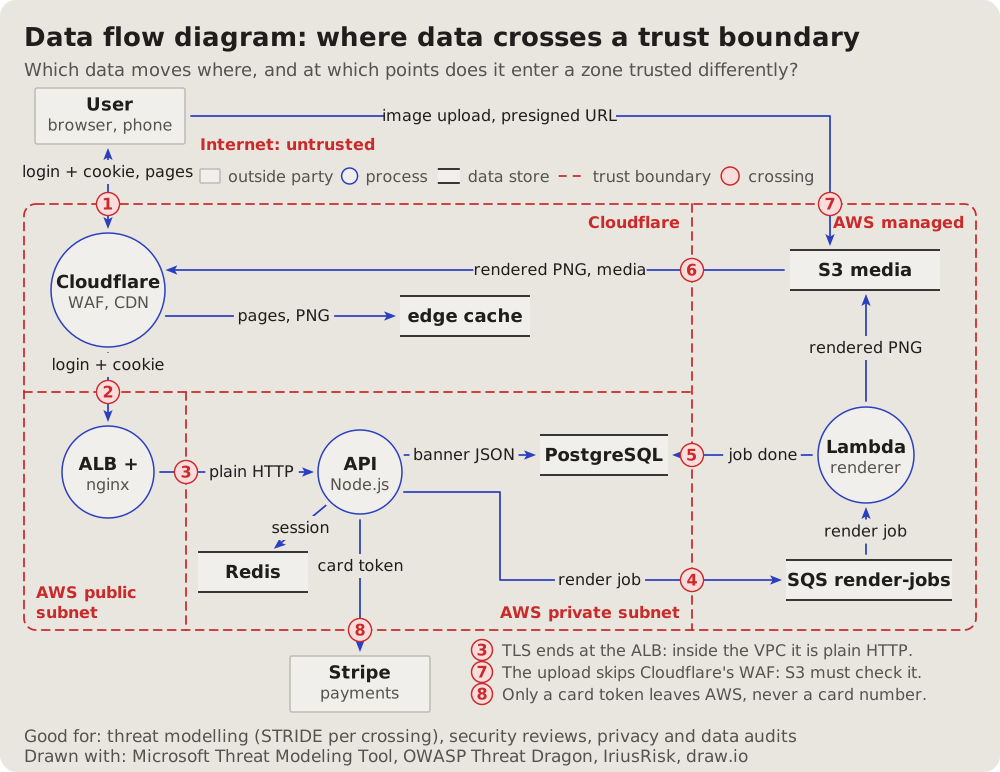
## Fits when
- **A security review or a threat model:** each crossing is a place to
ask what can go wrong (STRIDE per crossing).
- **Privacy:** where personal data goes and what leaves.
## Not when
- **Ports and rules:** a [network diagram](https://github.com/vbarbarosh/rules/blob/main/diagrams/network.md).
- **The order of one request:** a [sequence diagram](https://github.com/vbarbarosh/rules/blob/main/diagrams/sequence.md).
## How it is drawn
1. **Notation:** outside parties as boxes, processes as circles, stores as
two open lines; a key.
2. **Flows:** arrows named by their data ("card token"), not by protocol.
3. **Boundaries:** red dashed lines; a numbered badge where a flow
crosses one, the risky ones noted under the drawing.
37Dependency matrix: every link in a grid
The parts as rows and the same parts as columns; a filled cell where the row calls the column. Every link at once, however many, with no lines to cross.
Fits when
- Many parts: where a graph turns into a hairball.
- Layers and cycles: with the parts in order, a call below the diagonal goes against the layers.
Not when
How it is drawn
- Rows and columns: the same parts in the same order, the column names turned upright, groups bracketed on the left.
- Cells: filled where the row calls the column, with a port or a verb when it fits.
- Reading: a line under it says how ("the row calls the column").
# Dependency matrix: every link in a grid
The parts as rows and the same parts as columns; a filled cell where the
row calls the column. Every link at once, however many, with no lines to
cross.
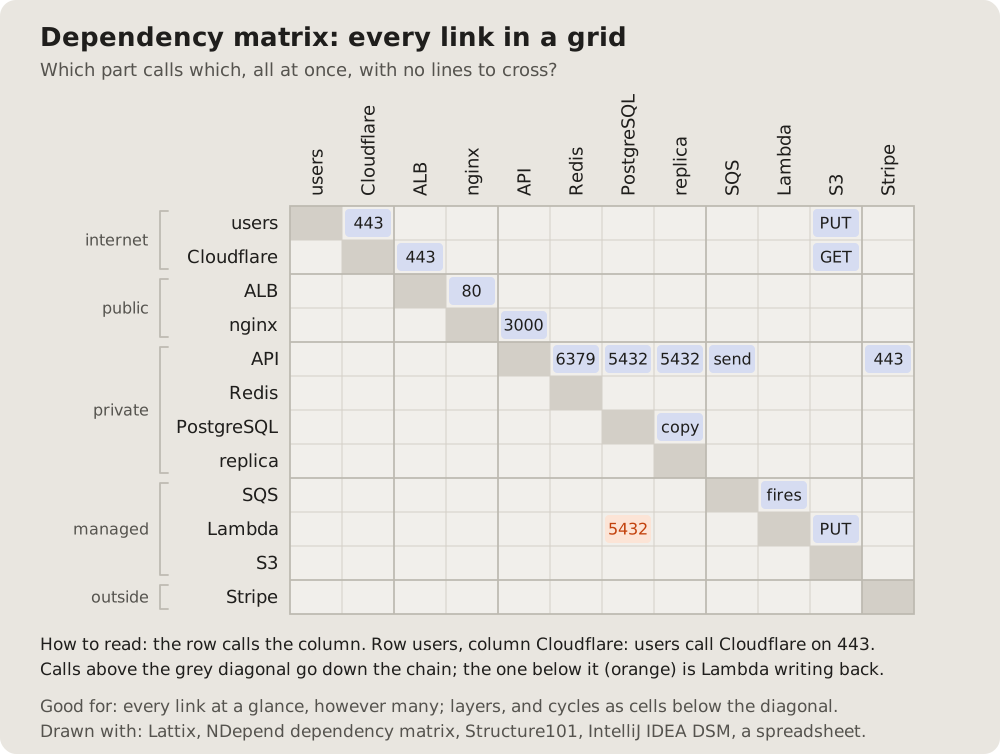
## Fits when
- **Many parts:** where a graph turns into a hairball.
- **Layers and cycles:** with the parts in order, a call below the
diagonal goes against the layers.
## Not when
- **A few parts:** a [layered diagram](https://github.com/vbarbarosh/rules/blob/main/diagrams/tiers.md) reads faster.
- **The order of the calls:** a [sequence diagram](https://github.com/vbarbarosh/rules/blob/main/diagrams/sequence.md).
## How it is drawn
1. **Rows and columns:** the same parts in the same order, the column
names turned upright, groups bracketed on the left.
2. **Cells:** filled where the row calls the column, with a port or a verb
when it fits.
3. **Reading:** a line under it says how ("the row calls the column").
38Call graph: which function calls which
A program from its entry down: each function a box, an arrow to each one it calls, the related ones framed together, the helpers everything leans on at the bottom.
Fits when
- A change is planned: what calls the function, what it touches.
- A newcomer reads a script: its steps and its shared helpers.
- Dead code: a function nothing points at.
Not when
How it is drawn
- Layers: the entry at the top, each call one row lower.
- Groups: light frames for the functions of one step.
- Too many: the main ones drawn, the rest a "+N more" box.
# Call graph: which function calls which
A program from its entry down: each function a box, an arrow to each one
it calls, the related ones framed together, the helpers everything leans
on at the bottom.
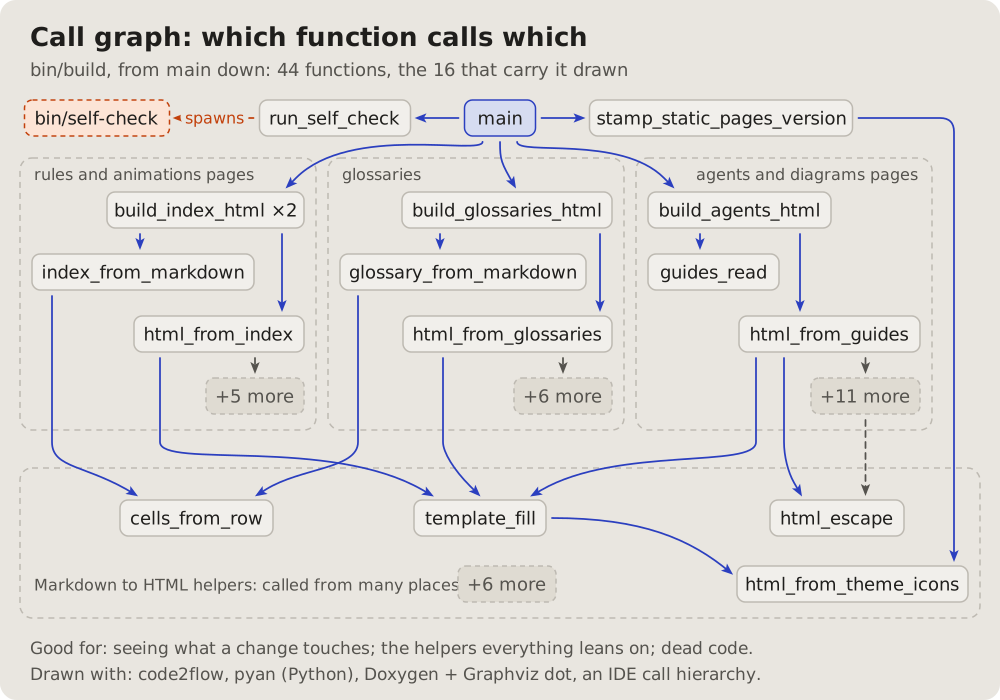
## Fits when
- **A change is planned:** what calls the function, what it touches.
- **A newcomer reads a script:** its steps and its shared helpers.
- **Dead code:** a function nothing points at.
## Not when
- **Files, not functions:** a [module graph](https://github.com/vbarbarosh/rules/blob/main/diagrams/modules.md).
- **What the script reads and writes:** a
[data flow of a script](https://github.com/vbarbarosh/rules/blob/main/diagrams/pipeline.md).
- **Where the time goes:** a [flame graph](https://github.com/vbarbarosh/rules/blob/main/diagrams/flame.md).
## How it is drawn
1. **Layers:** the entry at the top, each call one row lower.
2. **Groups:** light frames for the functions of one step.
3. **Too many:** the main ones drawn, the rest a "+N more" box.
39Data flow of a script: files in, steps, files out
What a script reads on the left, the steps it makes of it in the middle, what it writes on the right; each arrow named by what passes along it.
Fits when
- "Where does my edit end up?": from a source file to the page.
- A build, an import, an export: a script whose job is files.
Not when
How it is drawn
- Files: a page icon and the path; inputs left, outputs right, the ones rewritten in place in their own colour.
- Steps: rounded boxes in the middle.
- Arrows: named by what passes ("Markdown", "index", "HTML").
# Data flow of a script: files in, steps, files out
What a script reads on the left, the steps it makes of it in the middle,
what it writes on the right; each arrow named by what passes along it.
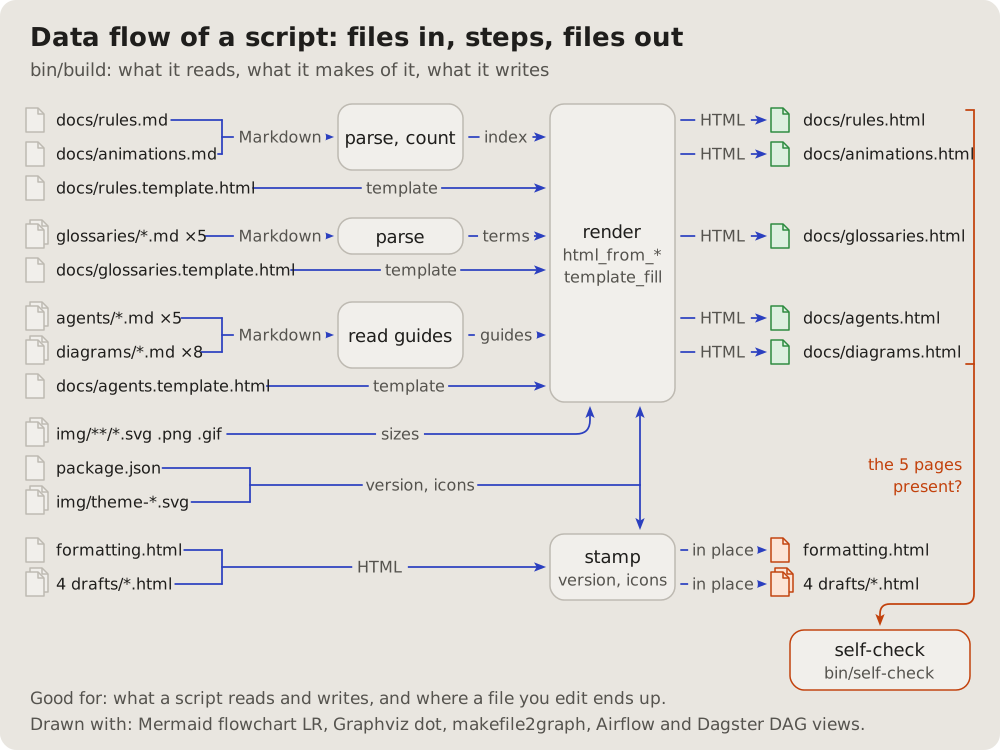
## Fits when
- **"Where does my edit end up?":** from a source file to the page.
- **A build, an import, an export:** a script whose job is files.
## Not when
- **The functions inside:** a [call graph](https://github.com/vbarbarosh/rules/blob/main/diagrams/callgraph.md).
- **A system of services:** a [layered diagram](https://github.com/vbarbarosh/rules/blob/main/diagrams/tiers.md).
## How it is drawn
1. **Files:** a page icon and the path; inputs left, outputs right, the
ones rewritten in place in their own colour.
2. **Steps:** rounded boxes in the middle.
3. **Arrows:** named by what passes ("Markdown", "index", "HTML").
40Module graph: which file needs which
The files of a project as boxes in their folders, an arrow from each file to each one it requires, the packages from outside in their own shape.
Fits when
- What breaks when a file changes: everything that points at it.
- Cycles and layers: an arrow that goes back up.
- What a script drags in from outside.
Not when
How it is drawn
- Folders: dashed frames named at the top left.
- Files and packages: a box with a folded corner for a file, a rounded one with a cube for a package.
- Arrows: blue for a require, dashed orange for running it as a process; "+N more" for the rest.
# Module graph: which file needs which
The files of a project as boxes in their folders, an arrow from each file
to each one it requires, the packages from outside in their own shape.
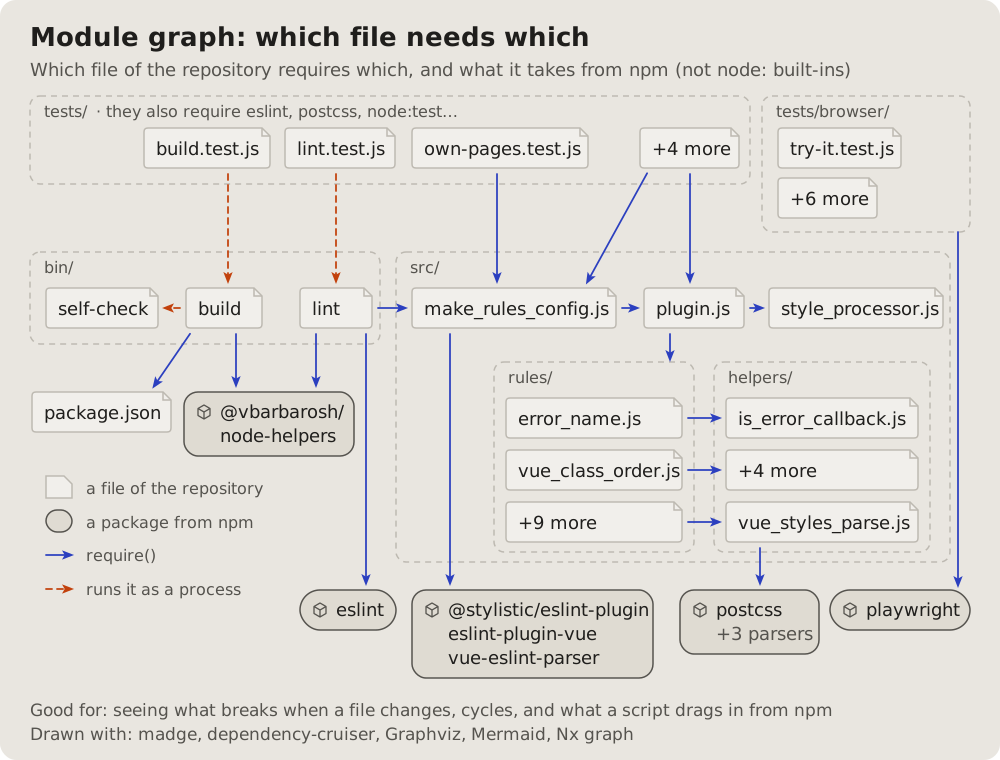
## Fits when
- **What breaks when a file changes:** everything that points at it.
- **Cycles and layers:** an arrow that goes back up.
- **What a script drags in** from outside.
## Not when
- **Functions inside one file:** a [call graph](https://github.com/vbarbarosh/rules/blob/main/diagrams/callgraph.md).
- **Hundreds of files:** a [dependency matrix](https://github.com/vbarbarosh/rules/blob/main/diagrams/matrix.md).
## How it is drawn
1. **Folders:** dashed frames named at the top left.
2. **Files and packages:** a box with a folded corner for a file, a
rounded one with a cube for a package.
3. **Arrows:** blue for a require, dashed orange for running it as a
process; "+N more" for the rest.
41Change map: what a change touches
The project's folder tree, trimmed to the files one change touches: each file a row, marked added, changed or removed, its lines added and removed at the right. The reader sees where the change lands and how big it is before reading the diff.
Fits when
- One commit or one pull request: which files it adds, changes and removes, and where in the project they sit.
- The question is where to look first: the big rows, the removed file, the one changed file in a folder of new ones.
- A change spreads over folders: code, tests and docs, and the reader sees that each got its part.
Not when
- Which file needs which: a module graph.
- How big each part of the code is, not what one change did: a treemap.
- A script's data flow, files in and files out: a pipeline.
How it is drawn
- The total: on top of the panel, the number of files, then how many added, changed and removed in their colours; the lines added in green and removed in red at the right.
- The tree: folders in bold with a slash, each level indented, thin grey lines from a folder to what it holds.
- The files: one row each, a mark and its name in colour: green + added, blue ~ changed, red − removed and struck through.
- The lines: at the right of each file, the lines added and removed as numbers, then a bar of green and red as long as they are.
- What it leaves alone: folders and files the change does not touch fold into one grey row, "… 4 more files" or "… bin/, public/".
- Now: a blue box under the panel says in one sentence what the change is and which file to check first.
# Change map: what a change touches
The project's folder tree, trimmed to the files one change touches: each
file a row, marked added, changed or removed, its lines added and
removed at the right. The reader sees where the change lands and how big
it is before reading the diff.
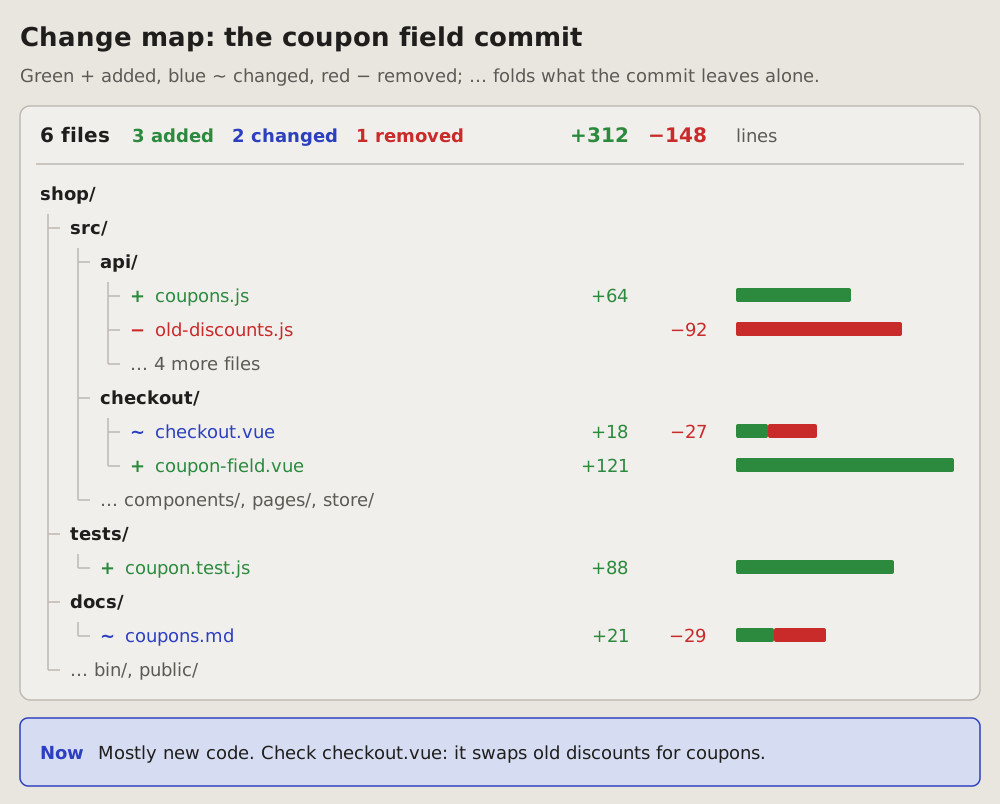
## Fits when
- **One commit or one pull request:** which files it adds, changes and
removes, and where in the project they sit.
- **The question is where to look first:** the big rows, the removed
file, the one changed file in a folder of new ones.
- **A change spreads over folders:** code, tests and docs, and the
reader sees that each got its part.
## Not when
- **Which file needs which:** a [module graph](https://github.com/vbarbarosh/rules/blob/main/diagrams/modules.md).
- **How big each part of the code is,** not what one change did: a
[treemap](https://github.com/vbarbarosh/rules/blob/main/diagrams/treemap.md).
- **A script's data flow,** files in and files out: a
[pipeline](https://github.com/vbarbarosh/rules/blob/main/diagrams/pipeline.md).
## How it is drawn
1. **The total:** on top of the panel, the number of files, then how
many added, changed and removed in their colours; the lines added in
green and removed in red at the right.
2. **The tree:** folders in bold with a slash, each level indented, thin
grey lines from a folder to what it holds.
3. **The files:** one row each, a mark and its name in colour: green +
added, blue ~ changed, red − removed and struck through.
4. **The lines:** at the right of each file, the lines added and removed
as numbers, then a bar of green and red as long as they are.
5. **What it leaves alone:** folders and files the change does not touch
fold into one grey row, "… 4 more files" or "… bin/, public/".
6. **Now:** a blue box under the panel says in one sentence what the
change is and which file to check first.
42Before and after: what a change does to a system
One map of a system as it is after a change, each part marked by what the change did to it: added, changed, removed or the same. The counts on top say how big the change is before the reader looks at the map.
Fits when
- A change to how a system is built: a cache, a queue, a service added or taken out.
- The question is what moved: which parts are new, which are gone, which work differently, and what stays as it was.
- A review of a plan: the map after it is done, before it is started.
Not when
- Which files a commit touches: a change map.
- The order of the calls changes: a sequence diagram, today beside proposed.
- A change the author sees on screen: screenshots before and after.
- Nothing is added or removed, only settings: say it in a sentence.
How it is drawn
- The counts: on top, a pill per kind of change with its count (+ 1 added, ~ 1 changed, − 1 removed), then how many stay the same in grey.
- The parts: a box per part as in a container sketch, its name in bold and what it does under it, left to right in the order a request meets them.
- The marks: added green with a + on its corner; changed blue with a ~; removed red, dashed, its name struck through, with a −; the same in grey. Under the name of a marked part, what the change did to it, in its colour.
- The lines: as the parts they join: a new line green, a removed one red and dashed, the rest dark; a few words on each.
- Now: a blue box under the map says in one sentence what the system does differently.
References
- archify, by tt-a1i, Apache-2.0 licence: an agent skill that draws this kind from typed JSON into an interactive page; the kind came to this page from it, the picture is drawn here.
# Before and after: what a change does to a system
One map of a system as it is after a change, each part marked by what the
change did to it: added, changed, removed or the same. The counts on top
say how big the change is before the reader looks at the map.
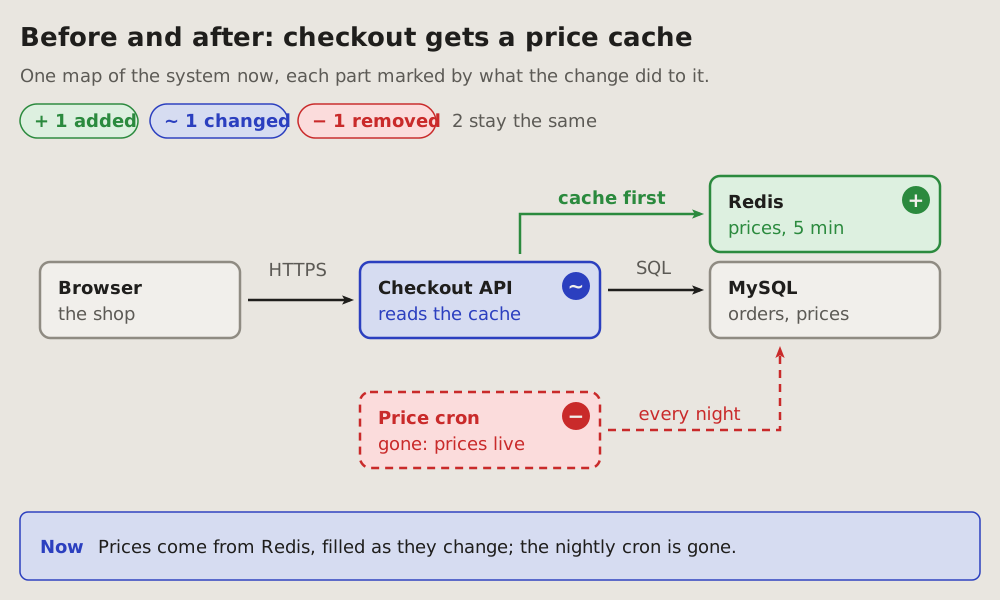
## Fits when
- **A change to how a system is built:** a cache, a queue, a service added
or taken out.
- **The question is what moved:** which parts are new, which are gone,
which work differently, and what stays as it was.
- **A review of a plan:** the map after it is done, before it is started.
## Not when
- **Which files a commit touches:** a [change map](https://github.com/vbarbarosh/rules/blob/main/diagrams/changemap.md).
- **The order of the calls changes:** a [sequence diagram](https://github.com/vbarbarosh/rules/blob/main/diagrams/sequence.md),
today beside proposed.
- **A change the author sees on screen:** screenshots before and after.
- **Nothing is added or removed,** only settings: say it in a sentence.
## How it is drawn
1. **The counts:** on top, a pill per kind of change with its count
(+ 1 added, ~ 1 changed, − 1 removed), then how many stay the same in
grey.
2. **The parts:** a box per part as in a
[container sketch](https://github.com/vbarbarosh/rules/blob/main/diagrams/containers.md), its name in bold and what it does
under it, left to right in the order a request meets them.
3. **The marks:** added green with a **+** on its corner; changed blue
with a **~**; removed red, dashed, its name struck through, with a
**−**; the same in grey. Under the name of a marked part, what the
change did to it, in its colour.
4. **The lines:** as the parts they join: a new line green, a removed one
red and dashed, the rest dark; a few words on each.
5. **Now:** a blue box under the map says in one sentence what the system
does differently.
## References
- [archify](https://github.com/tt-a1i/archify), by tt-a1i, Apache-2.0
licence: an agent skill that draws this kind from typed JSON into an
interactive page; the kind came to this page from it, the picture is
drawn here.
43Flame graph: where one run spends its time
One measured run: each call stack a column of bars, the caller under the callee, each bar as wide as its share of the time. The widest bars at the top are where the time goes.
Fits when
- "Why is it slow?": the time of a run by function, measured.
- Before and after a speed fix: the same bar, narrower.
Not when
How it is drawn
- Bars: bottom-up, the whole run at the bottom, widths to one scale, the name and the milliseconds in each.
- Too narrow: a letter in the bar, its name in a key; a narrow part that matters zoomed above.
- Self time: the bars that spend it themselves marked in orange.
References
- Flame graphs, invented by Brendan Gregg: this guide draws his kind; the picture is drawn here.
# Flame graph: where one run spends its time
One measured run: each call stack a column of bars, the caller under the
callee, each bar as wide as its share of the time. The widest bars at the
top are where the time goes.
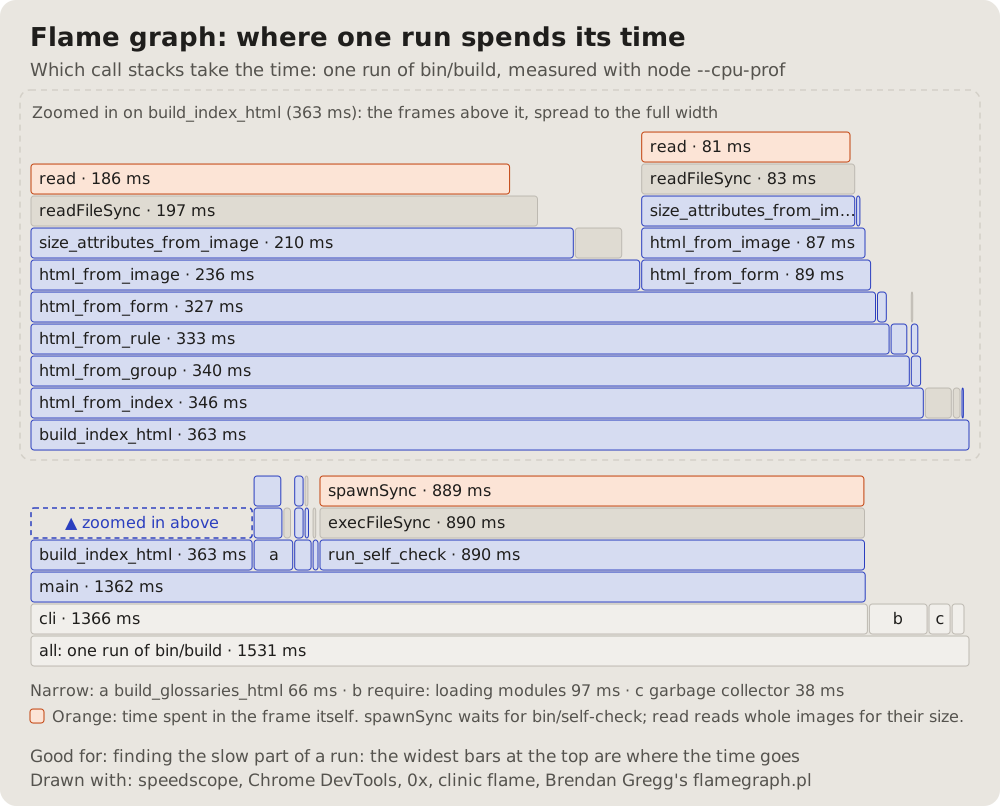
## Fits when
- **"Why is it slow?":** the time of a run by function, measured.
- **Before and after a speed fix:** the same bar, narrower.
## Not when
- **The structure, not the time:** a [call graph](https://github.com/vbarbarosh/rules/blob/main/diagrams/callgraph.md).
- **Time across services:** a [sequence diagram](https://github.com/vbarbarosh/rules/blob/main/diagrams/sequence.md) of a trace.
## How it is drawn
1. **Bars:** bottom-up, the whole run at the bottom, widths to one scale,
the name and the milliseconds in each.
2. **Too narrow:** a letter in the bar, its name in a key; a narrow part
that matters zoomed above.
3. **Self time:** the bars that spend it themselves marked in orange.
## References
- [Flame graphs](https://www.brendangregg.com/flamegraphs.html), invented
by Brendan Gregg: this guide draws his kind; the picture is drawn here.
44Code map: how big each part is
A treemap of the code: each function a rectangle, its area its lines, grouped by the part of the program it belongs to.
Fits when
- Where the code is: the big parts to split, the parts that grow.
- A first look at a large file or project.
Not when
How it is drawn
- Groups: a frame per part, its name and its lines in the header.
- Rectangles: one per function, area by lines, the name and the count when they fit.
- The small ones: merged into a dashed "N small functions" box.
References
- Treemaps, invented by Ben Shneiderman: this guide draws his kind; the picture is drawn here.
# Code map: how big each part is
A treemap of the code: each function a rectangle, its area its lines,
grouped by the part of the program it belongs to.
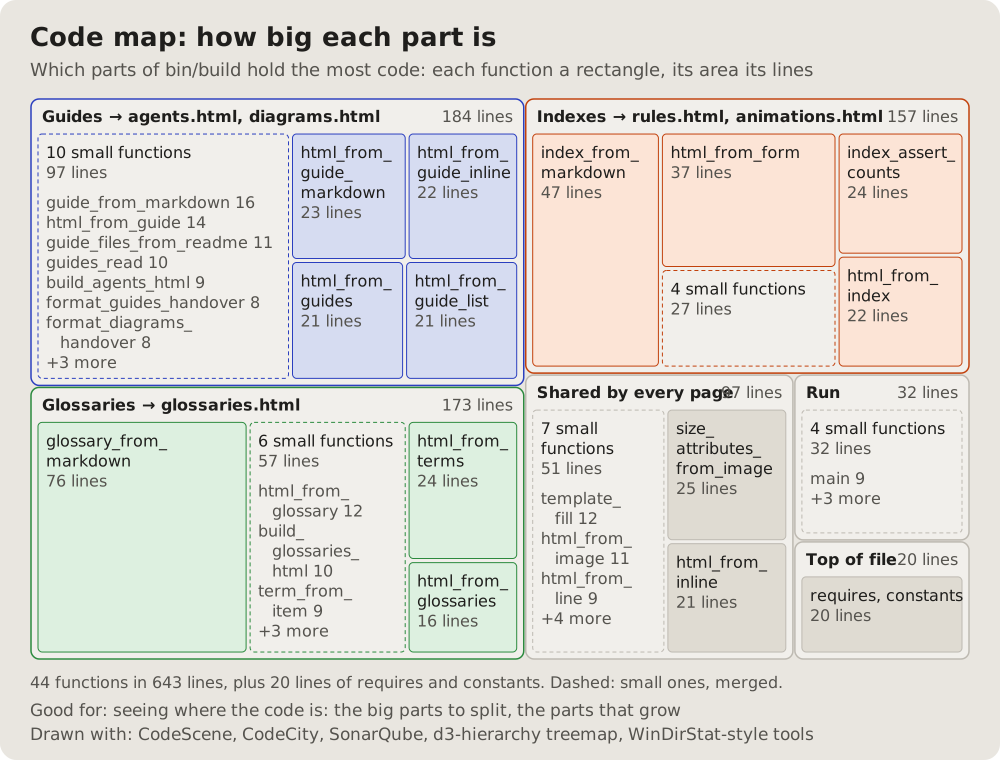
## Fits when
- **Where the code is:** the big parts to split, the parts that grow.
- **A first look at a large file or project.**
## Not when
- **Who calls whom:** a [call graph](https://github.com/vbarbarosh/rules/blob/main/diagrams/callgraph.md).
- **Where the time goes:** a [flame graph](https://github.com/vbarbarosh/rules/blob/main/diagrams/flame.md); size is not cost.
## How it is drawn
1. **Groups:** a frame per part, its name and its lines in the header.
2. **Rectangles:** one per function, area by lines, the name and the count
when they fit.
3. **The small ones:** merged into a dashed "N small functions" box.
## References
- [Treemaps](https://www.cs.umd.edu/hcil/treemap-history/), invented by
Ben Shneiderman: this guide draws his kind; the picture is drawn here.
45Diagram Design: 25 kinds this page has no guide for
diagram-design is an agent skill that draws 50 kinds of diagram, each a page with one SVG written by hand. These are the 25 this page has no guide for, each in diagram-design's own example, recoloured into this page's colours, light and dark; the shapes, words and sizes are its own. They are not guides yet: a kind this page takes in gets a guide of its own.
How it works
Process: a step per box in the lane of the team that does it, numbered across the top, the data each hands on as a tag; the critical hand-off in the accent. Credit: diagram-design's example-process.html, © 2025 Cathryn Lavery, MIT licence, recoloured.
Service blueprint: a path in stages, what the customer does and sees above the line of visibility, what runs backstage below it; the step that fails in the accent. Credit: diagram-design's example-service-blueprint.html, © 2025 Cathryn Lavery, MIT licence, recoloured.
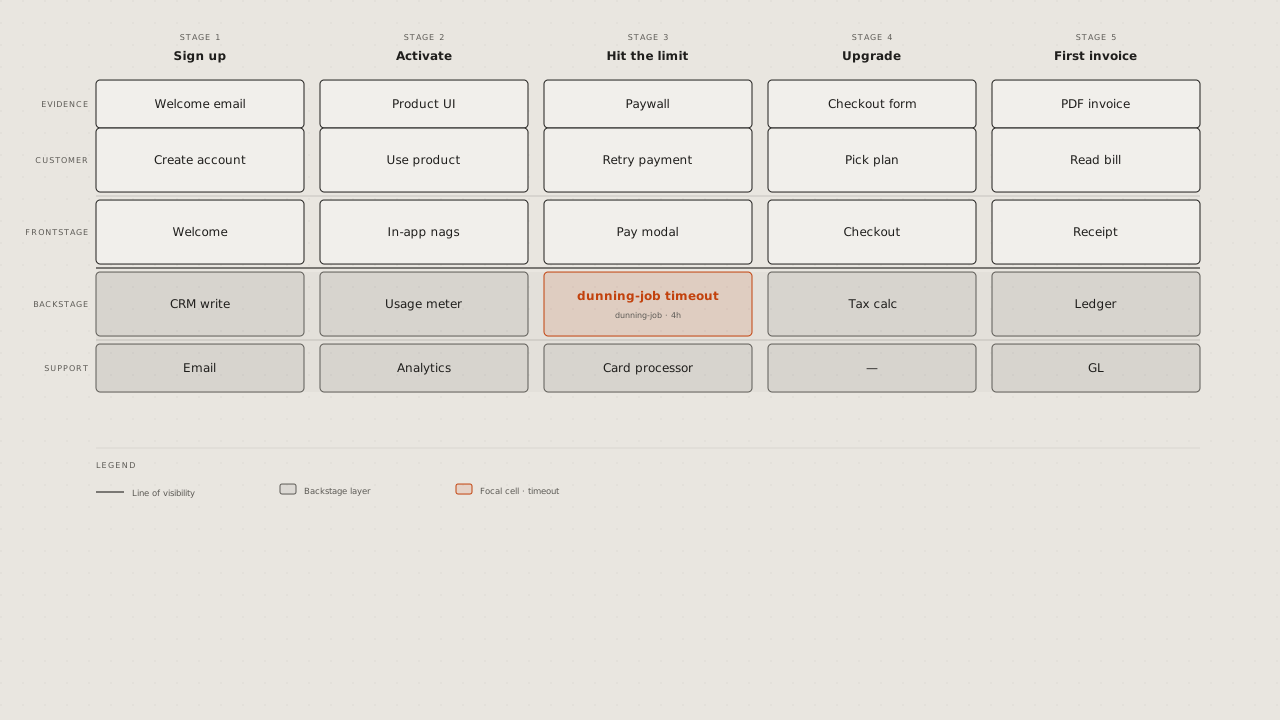
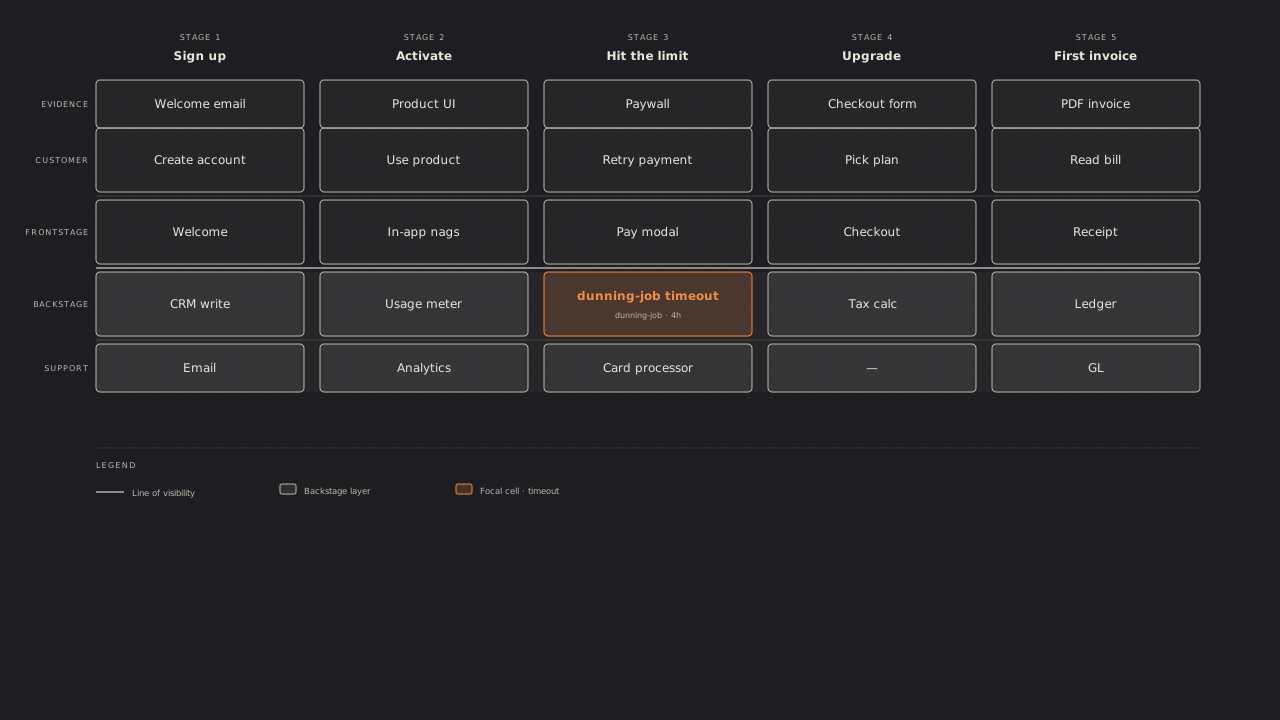
User journey: a person's stages across, their actions and touchpoints under each, a line of how they feel that dips where it hurts. Credit: diagram-design's example-journey.html, © 2025 Cathryn Lavery, MIT licence, recoloured.
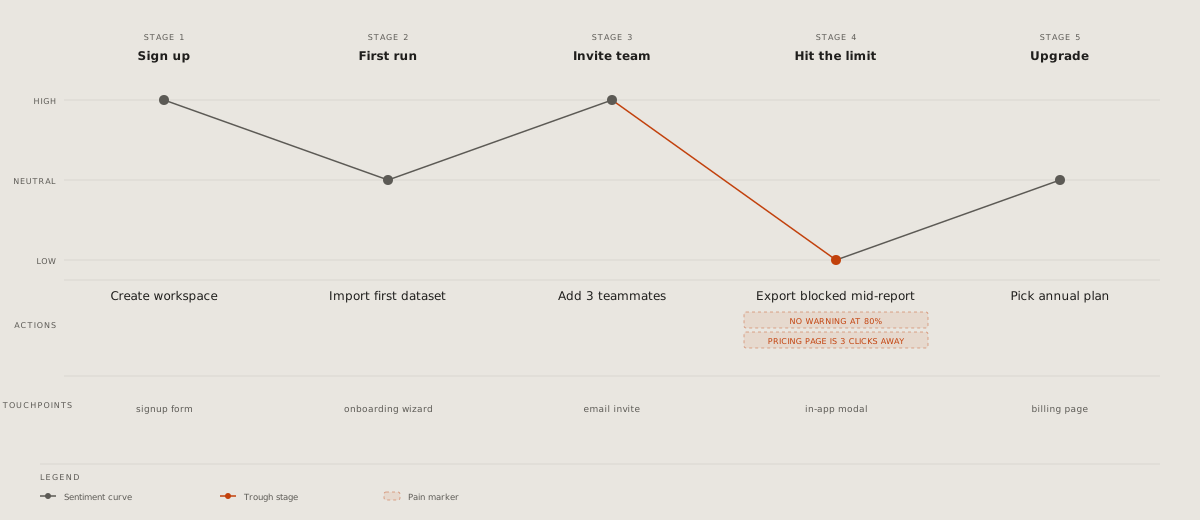
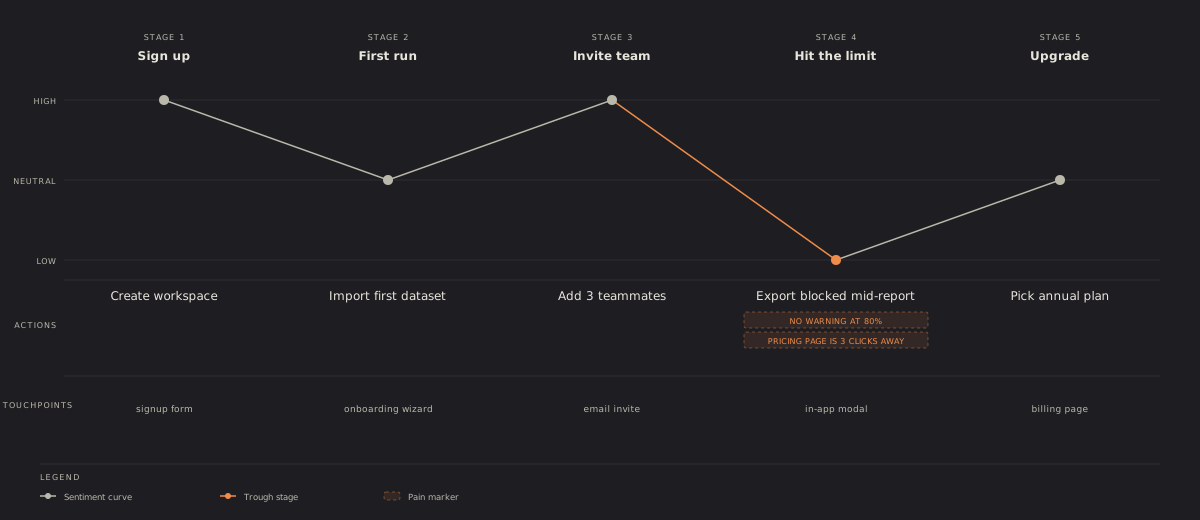
Event modelling: time left to right; for each stage the command, the event it leaves, named in the past tense, and the view read from that event. Credit: diagram-design's example-event-modeling.html, © 2025 Cathryn Lavery, MIT licence, recoloured.
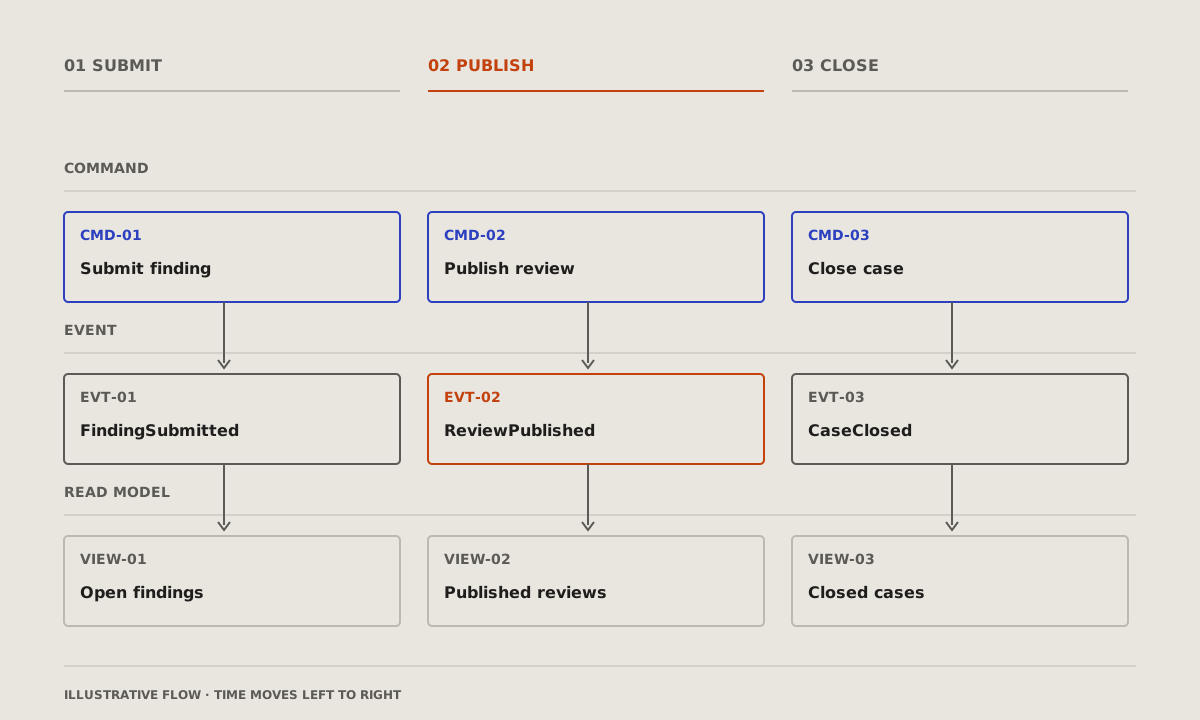
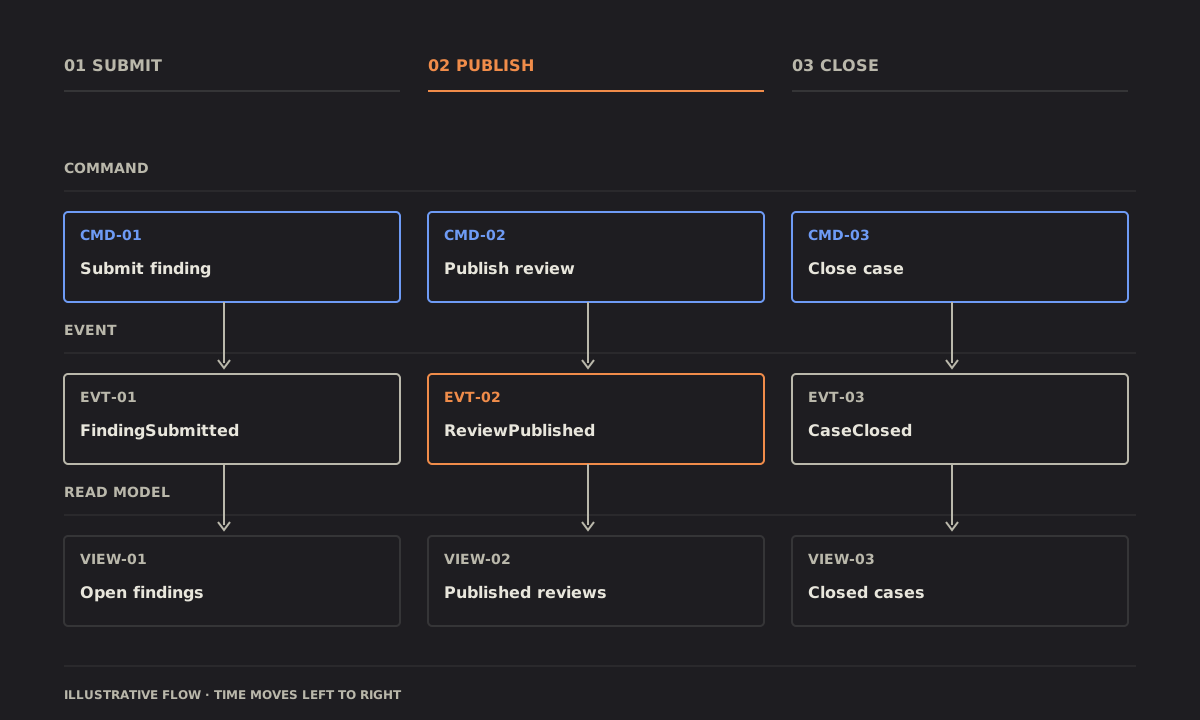
What it is made of
Nested: scopes inside scopes, the widest outside, the one that matters innermost. Credit: diagram-design's example-nested.html, © 2025 Cathryn Lavery, MIT licence, recoloured.
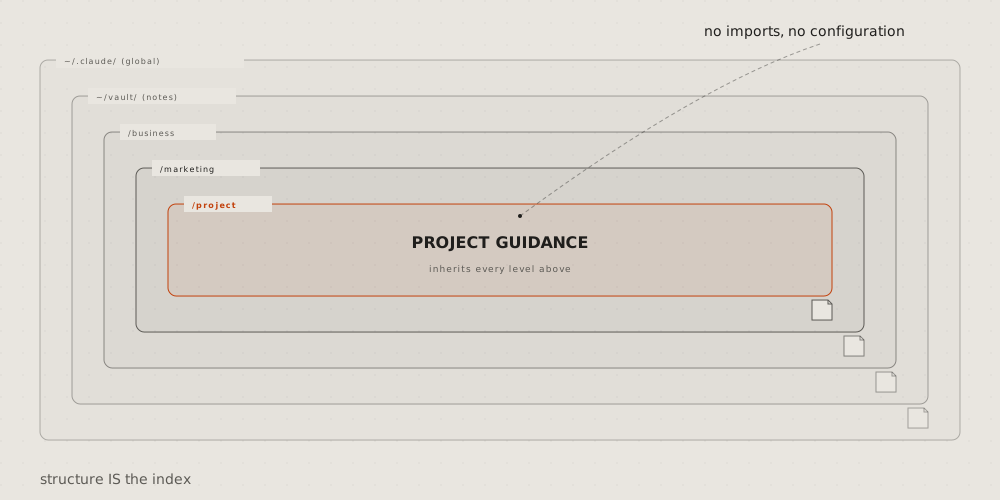
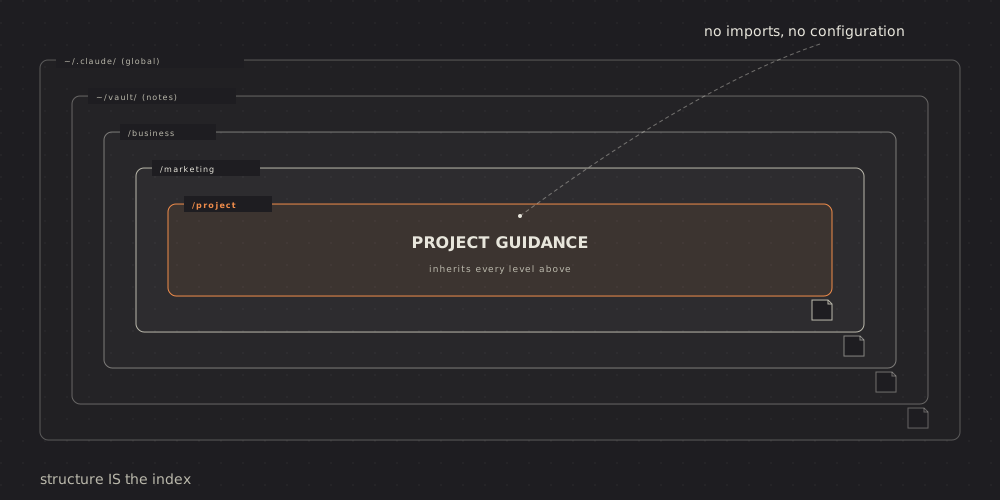
Layer stack: levels as bands one on another, the lowest at the bottom; the layer that matters in the accent. Credit: diagram-design's example-layers.html, © 2025 Cathryn Lavery, MIT licence, recoloured.
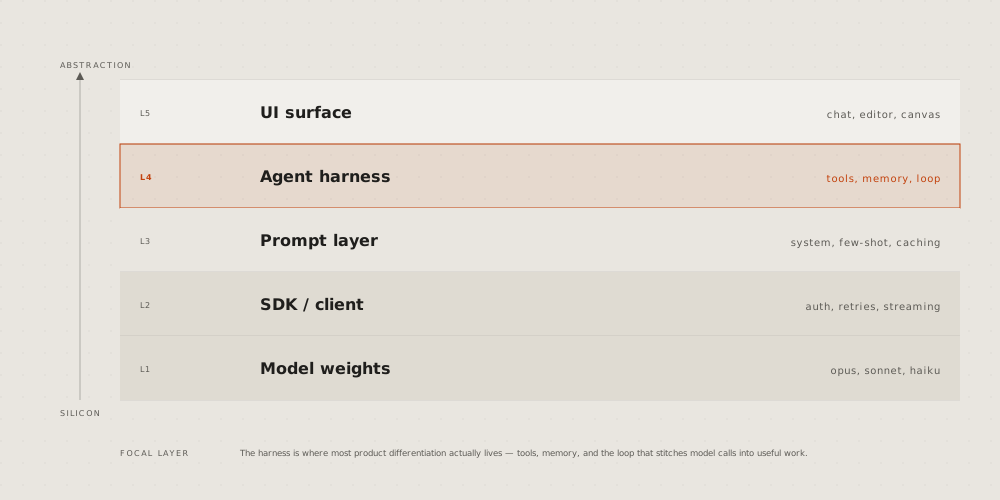
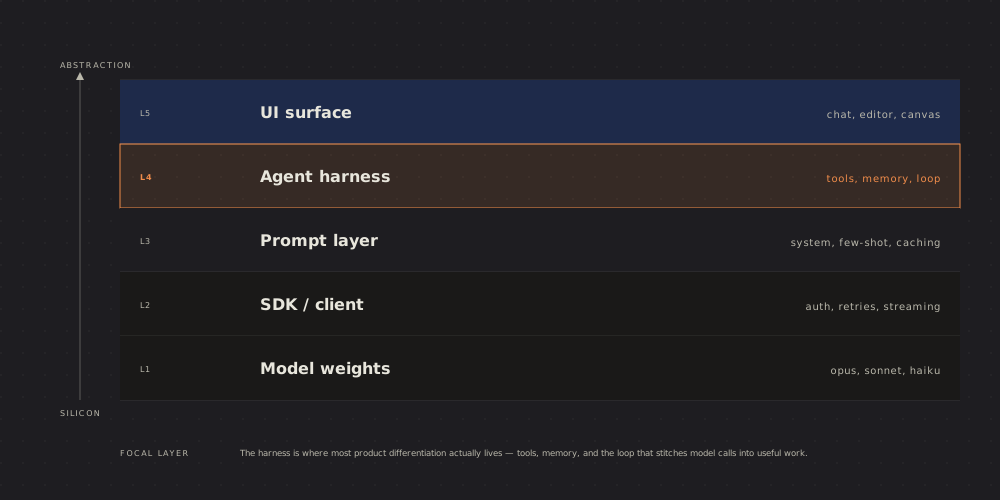
Org chart: who reports to whom, a row per level, lines down from each lead. Credit: diagram-design's example-org-chart.html, © 2025 Cathryn Lavery, MIT licence, recoloured.
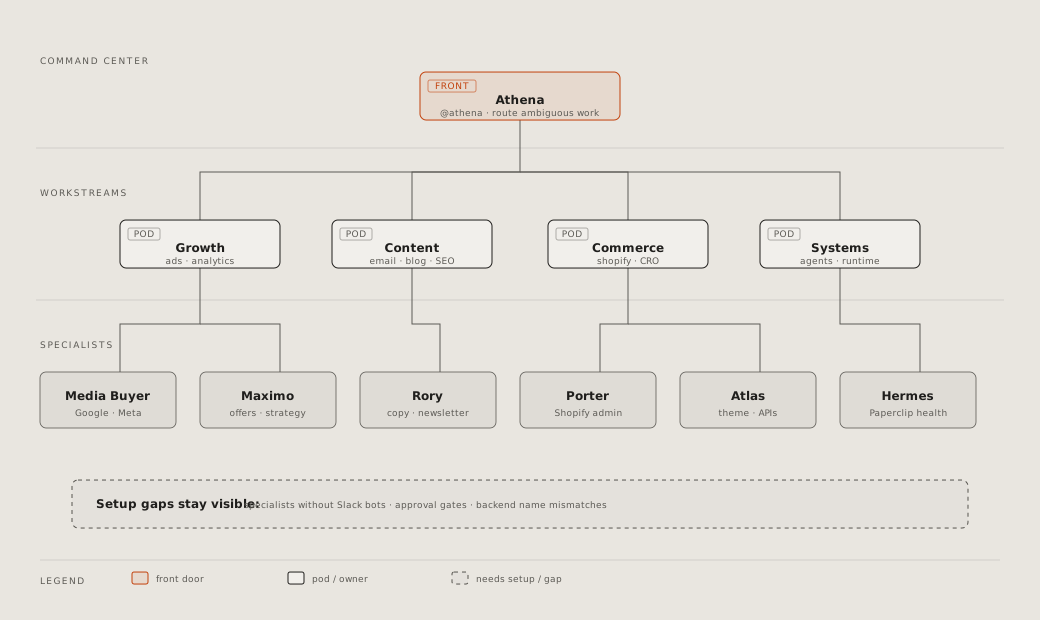
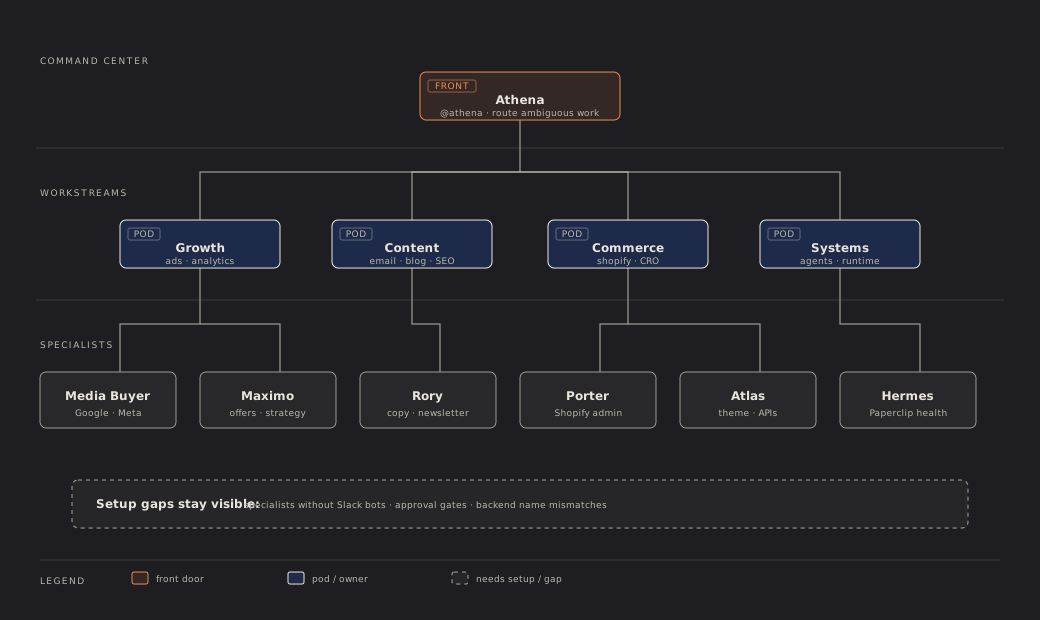
Database schema: a box per table, its columns, types and keys; a line from each foreign key to the key it names, a group per schema. Credit: diagram-design's example-db-schema.html, © 2025 Cathryn Lavery, MIT licence, recoloured.
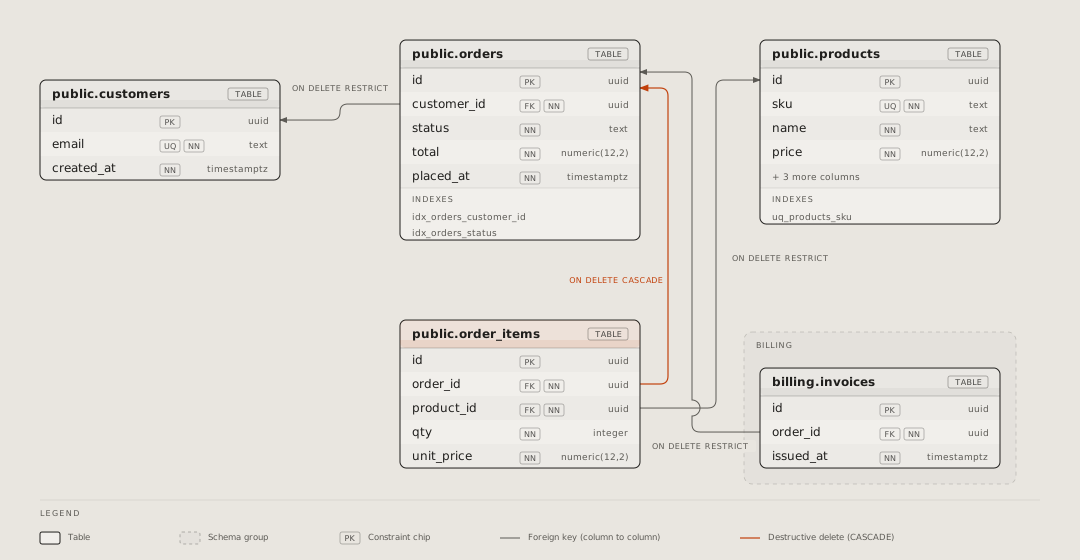
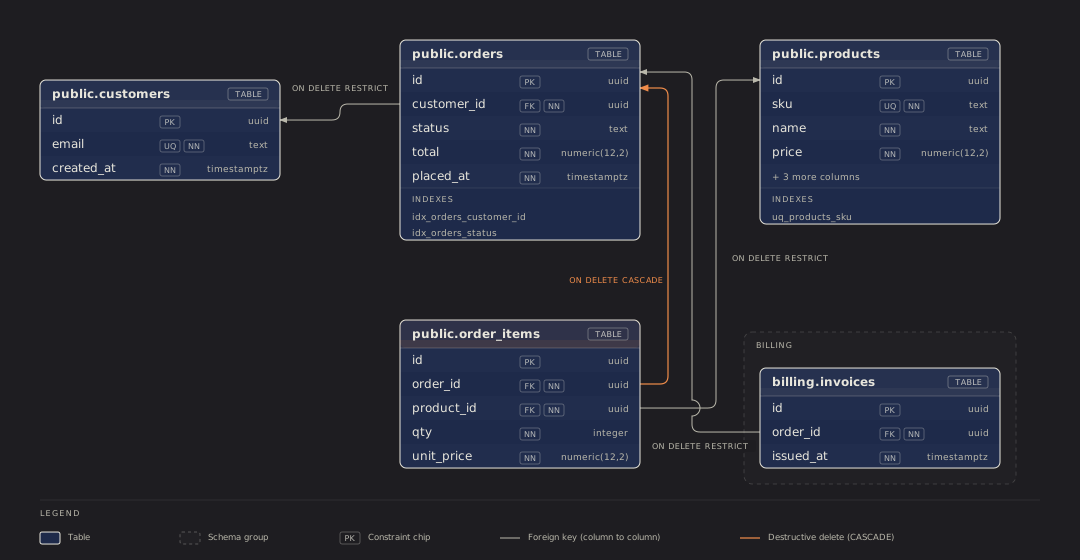
Exploded view: one thing's layers pulled apart in depth, each named at the side. Credit: diagram-design's example-exploded.html, © 2025 Cathryn Lavery, MIT licence, recoloured.
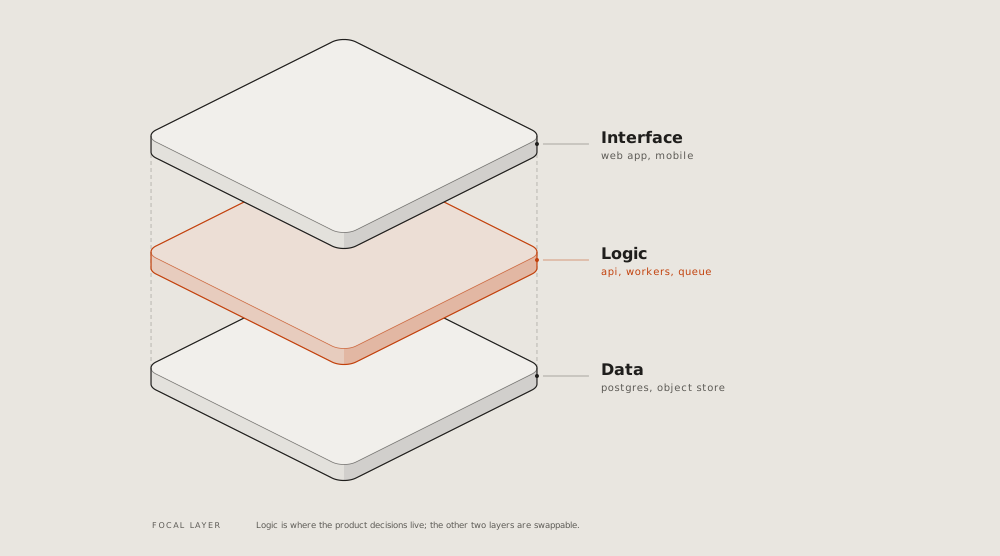
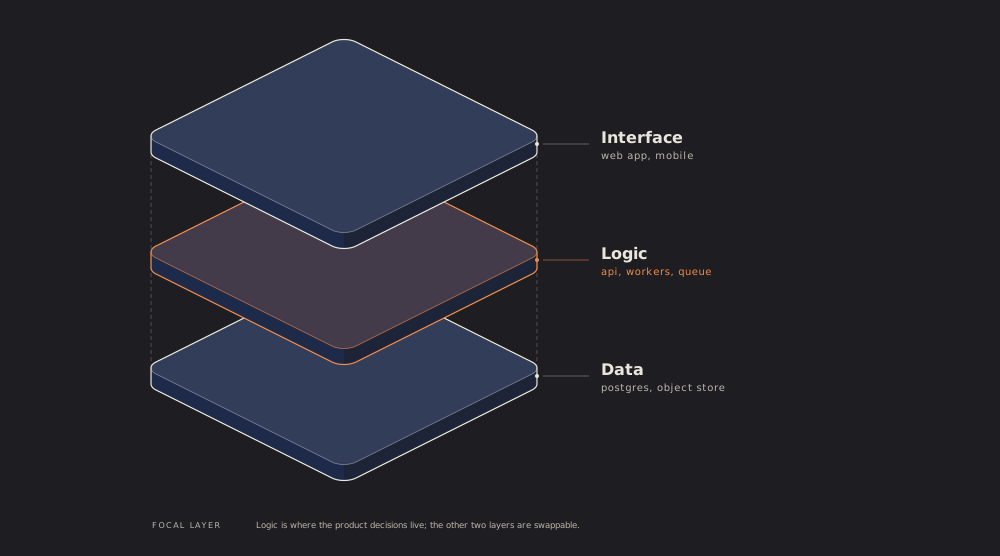
Axonometric plan: a floor or a site from above, at an angle, its rooms named; the one under discussion in the accent. Credit: diagram-design's example-axonometric-plan.html, © 2025 Cathryn Lavery, MIT licence, recoloured.
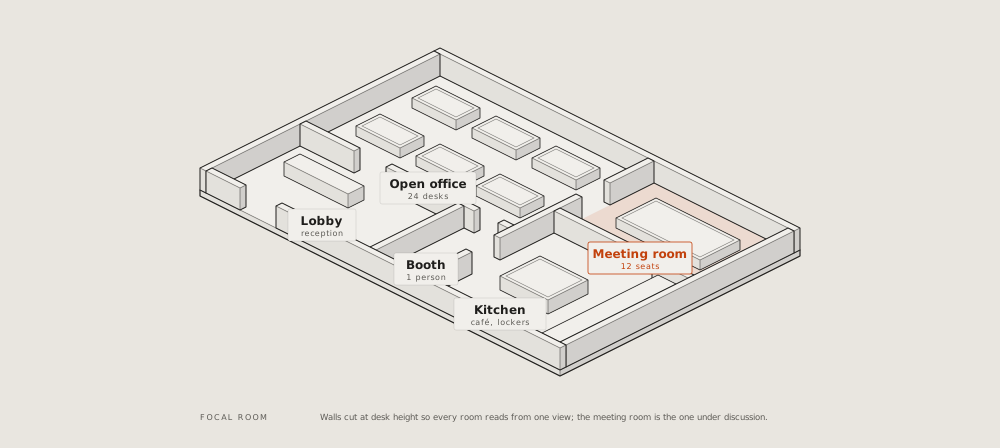
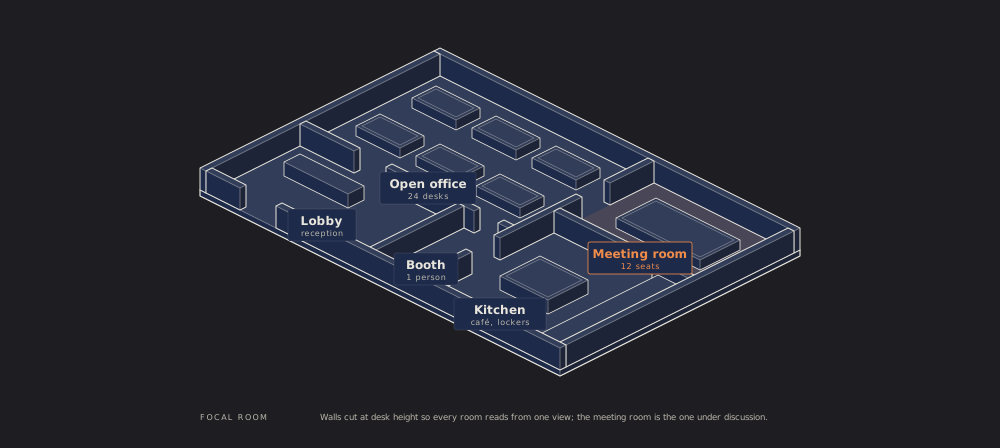
Where it stands
Story map: the user's activities across as a backbone, the stories under each, cut into releases by lines; the riskiest story marked. Credit: diagram-design's example-story-map.html, © 2025 Cathryn Lavery, MIT licence, recoloured.
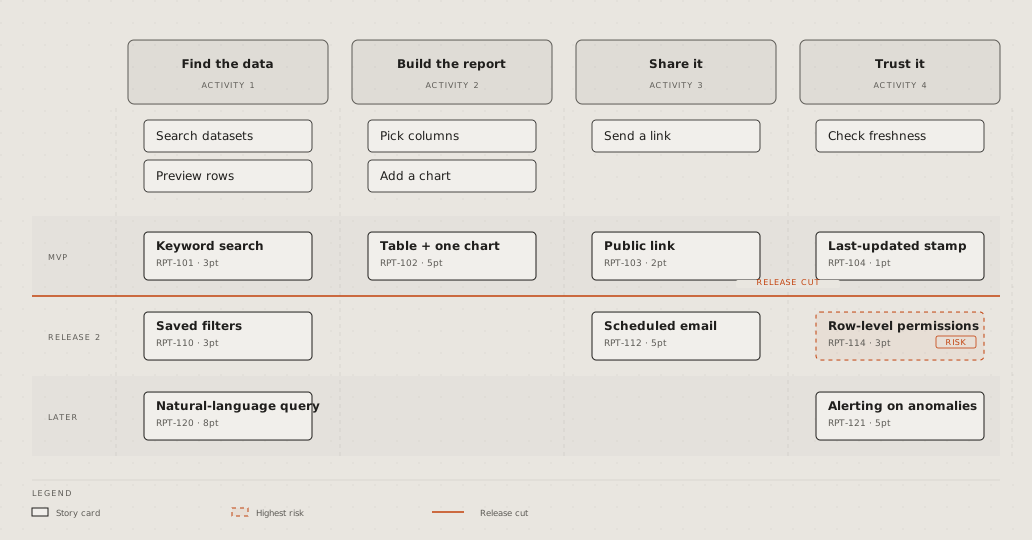
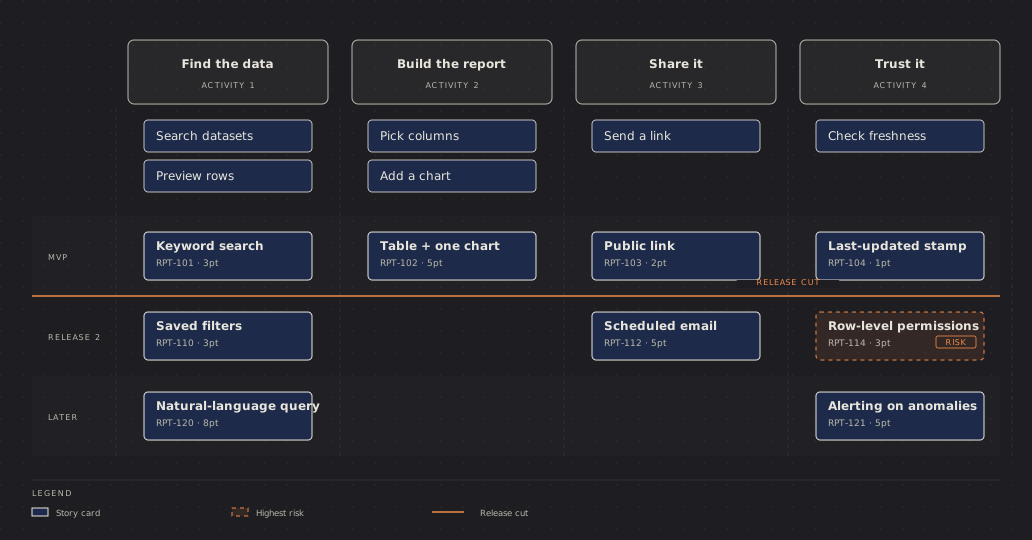
Traceability: each need traced by its id to the design that meets it and the test that checks it; a need with no test in the accent. Credit: diagram-design's example-requirement-traceability.html, © 2025 Cathryn Lavery, MIT licence, recoloured.
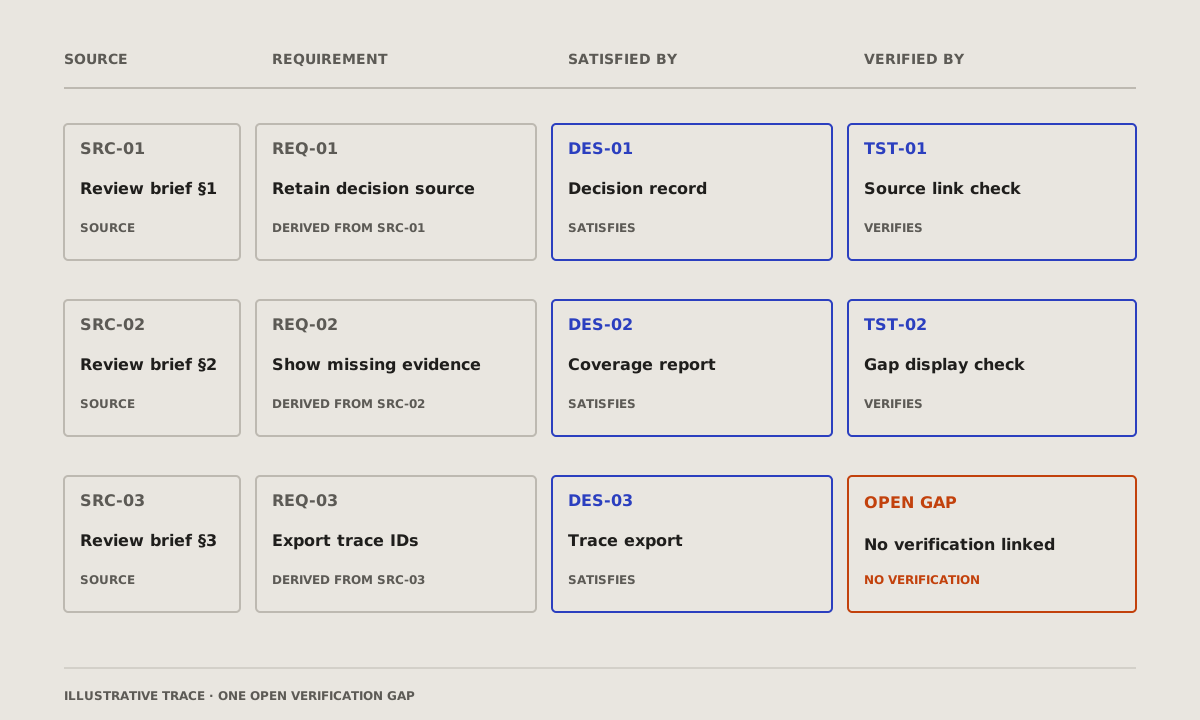
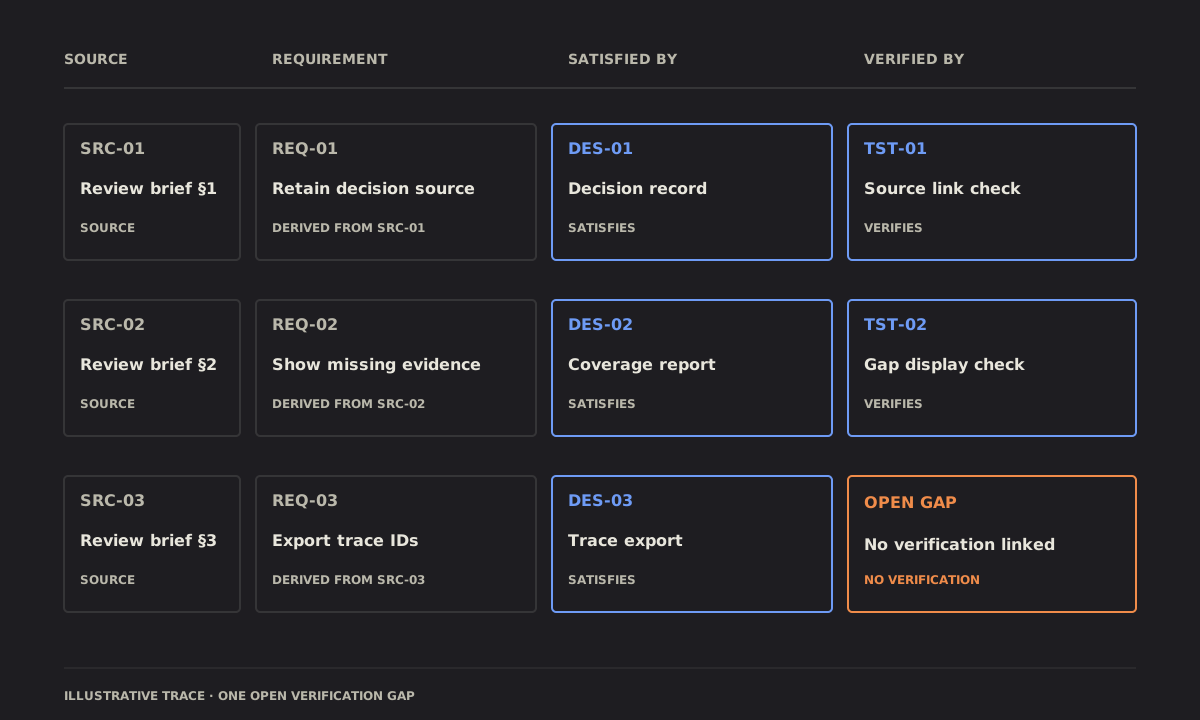
What it changes
Wardley map: the parts of a product from what the user sees down to what nobody sees, placed by how mature each is, from new to commodity; an arrow where one is moving. Credit: diagram-design's example-wardley.html, © 2025 Cathryn Lavery, MIT licence, recoloured.
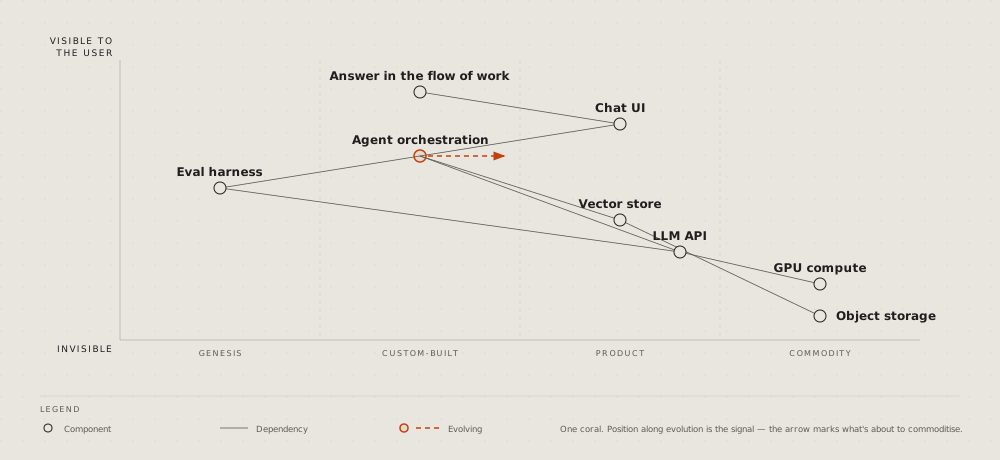
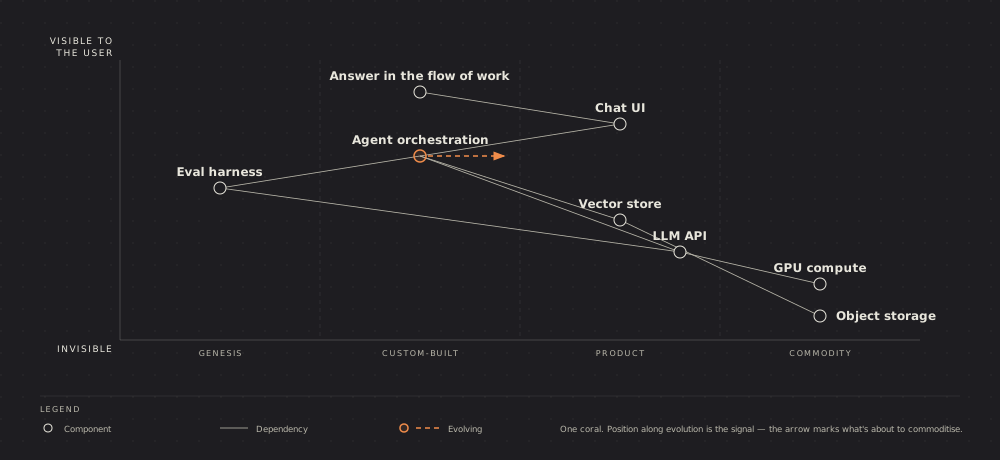
How much
Scatter plot: two numbers per item, a dot each, the trend as a line; the one that matters named. Credit: diagram-design's example-scatter.html, © 2025 Cathryn Lavery, MIT licence, recoloured.
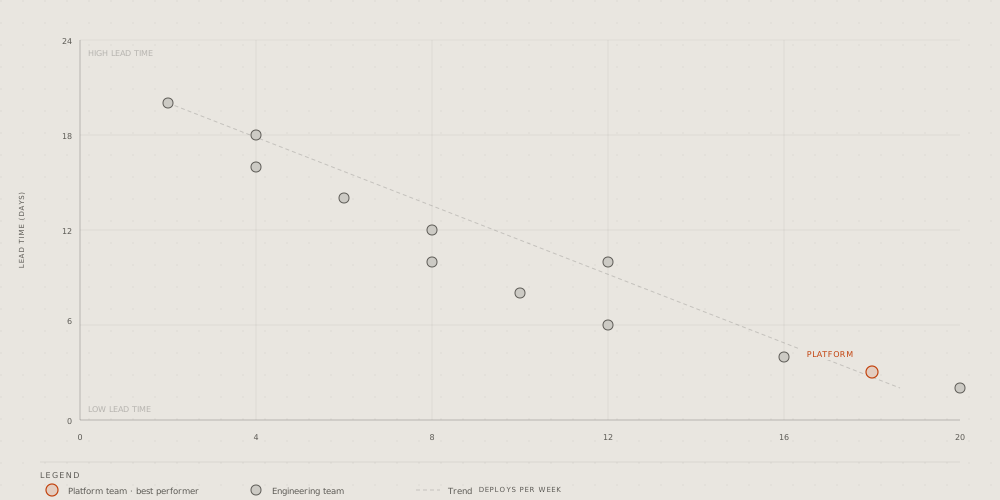
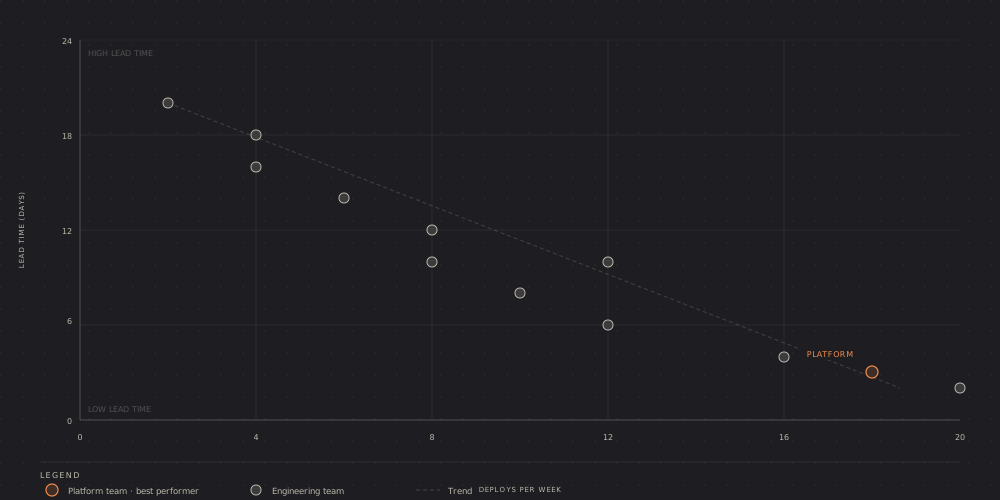
Radar: a few options scored on three to six criteria, a shape per option on the spokes. Credit: diagram-design's example-radar.html, © 2025 Cathryn Lavery, MIT licence, recoloured.
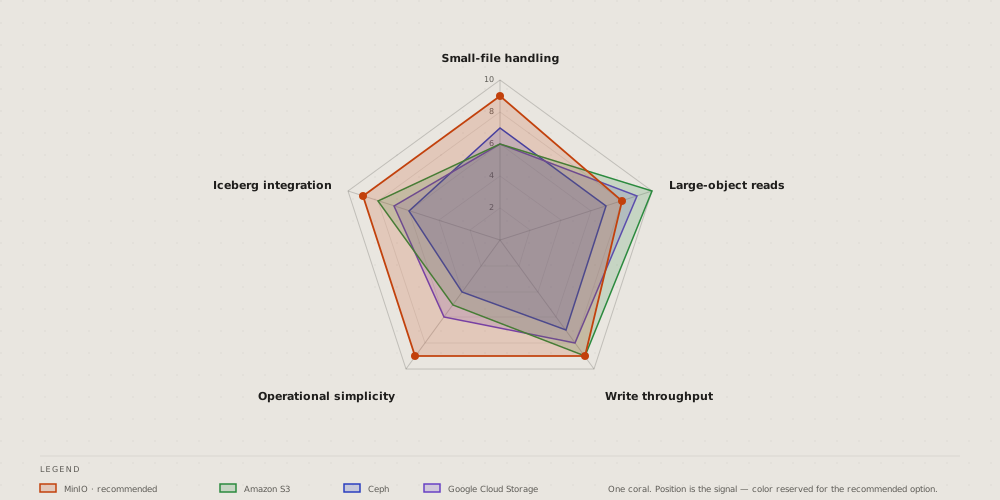
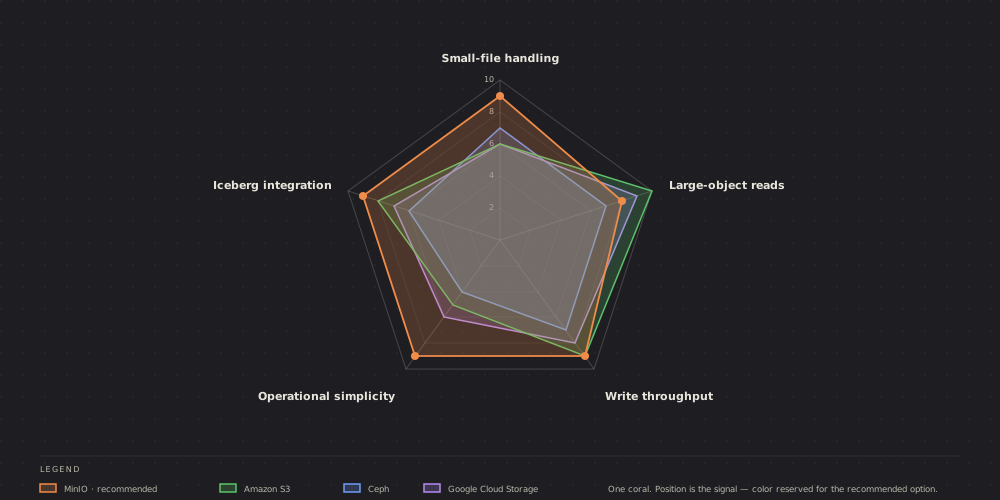
Polar chart: one number around a cycle, the hours of a day as spokes; the peak in the accent. Credit: diagram-design's example-polar.html, © 2025 Cathryn Lavery, MIT licence, recoloured.
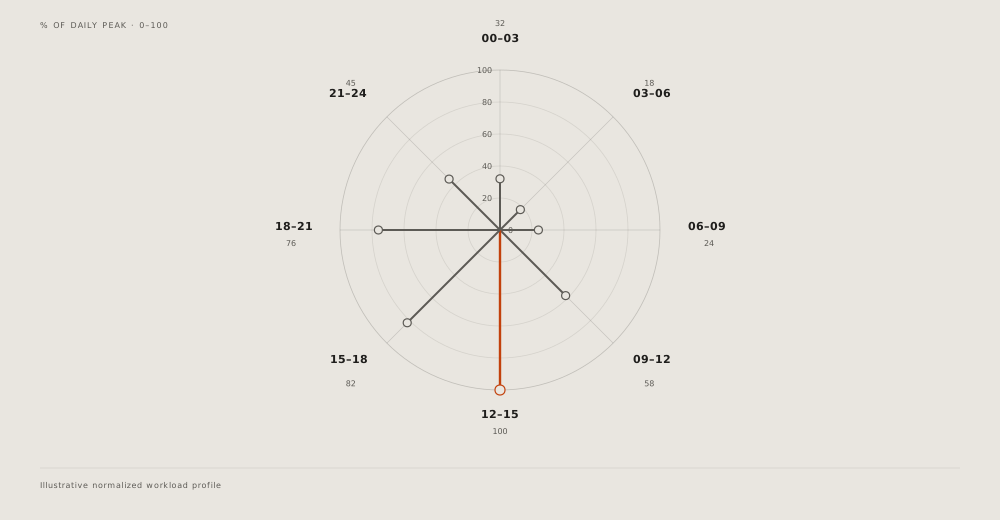
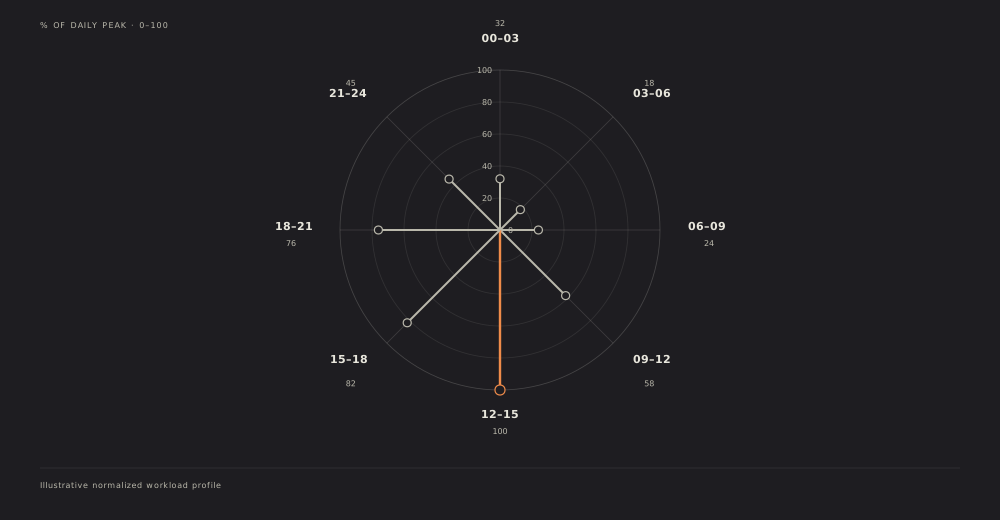
Pyramid: levels from a wide base to a narrow top, the rare and valuable at the apex; turned over, a funnel. Credit: diagram-design's example-pyramid.html, © 2025 Cathryn Lavery, MIT licence, recoloured.
Venn: what two or three sets share; the overlap that matters named. Credit: diagram-design's example-venn.html, © 2025 Cathryn Lavery, MIT licence, recoloured.
Waterfall, a running total: where it starts, each step up or down as a floating bar, where it ends; not the waterfall of one request's time. Credit: diagram-design's example-waterfall.html, © 2025 Cathryn Lavery, MIT licence, recoloured.
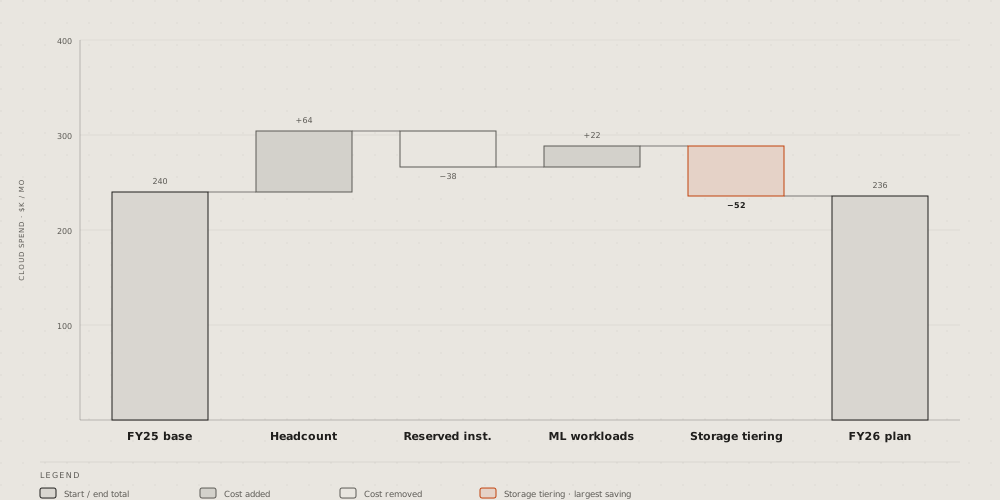
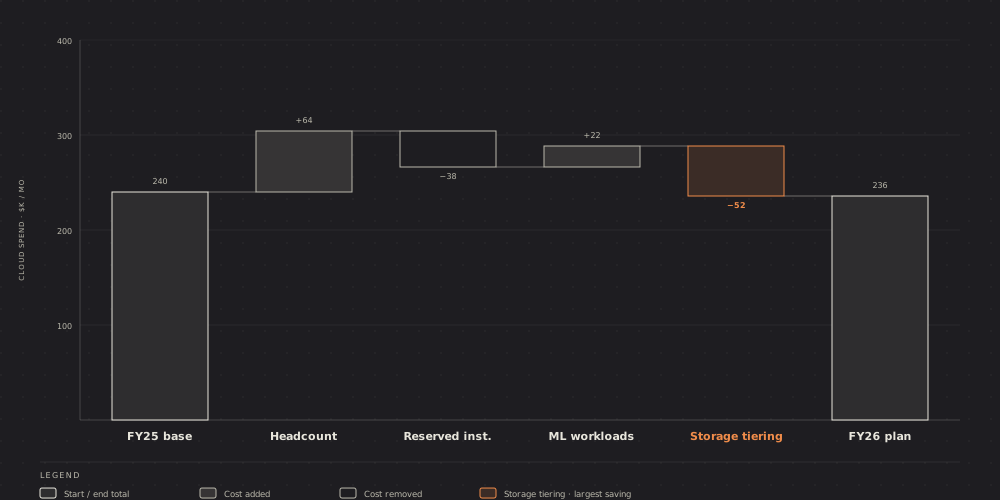
For one trade
High-level data stack: a data platform end to end, from the sources through ingestion, storage and query to the dashboards, on its cluster. Credit: diagram-design's example-high-level.html, © 2025 Cathryn Lavery, MIT licence, recoloured.
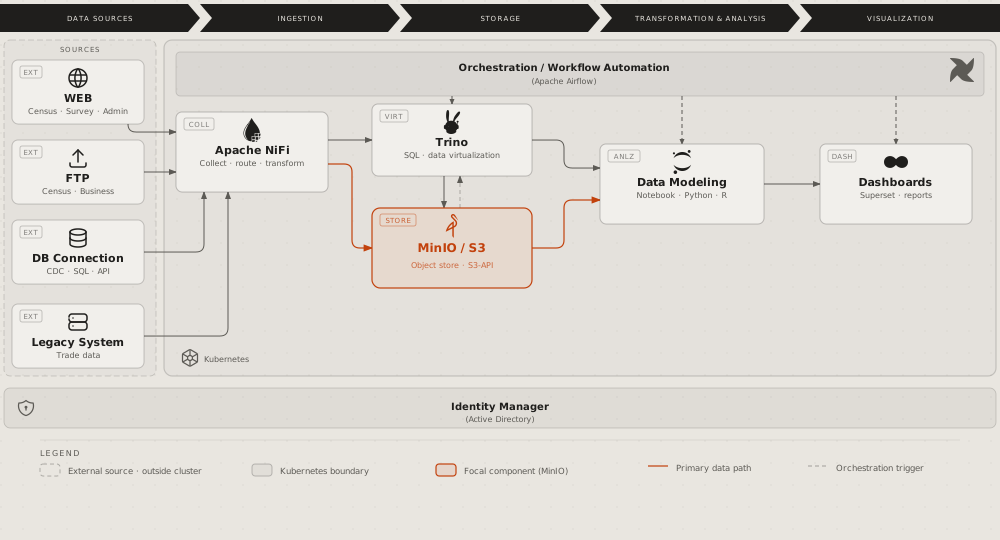
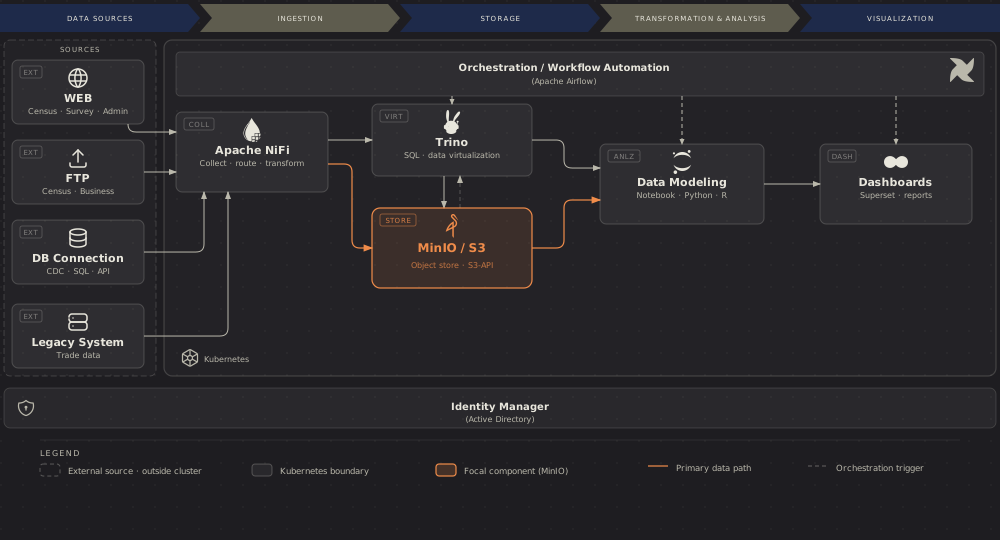
Medallion: data kept in tiers by quality, from raw to aggregated, each tier's tool, format and writer. Credit: diagram-design's example-medallion.html, © 2025 Cathryn Lavery, MIT licence, recoloured.


Data platform integration: the systems that feed a platform, the consumers it serves, and the protocol on each link. Credit: diagram-design's example-dp-integration.html, © 2025 Cathryn Lavery, MIT licence, recoloured.
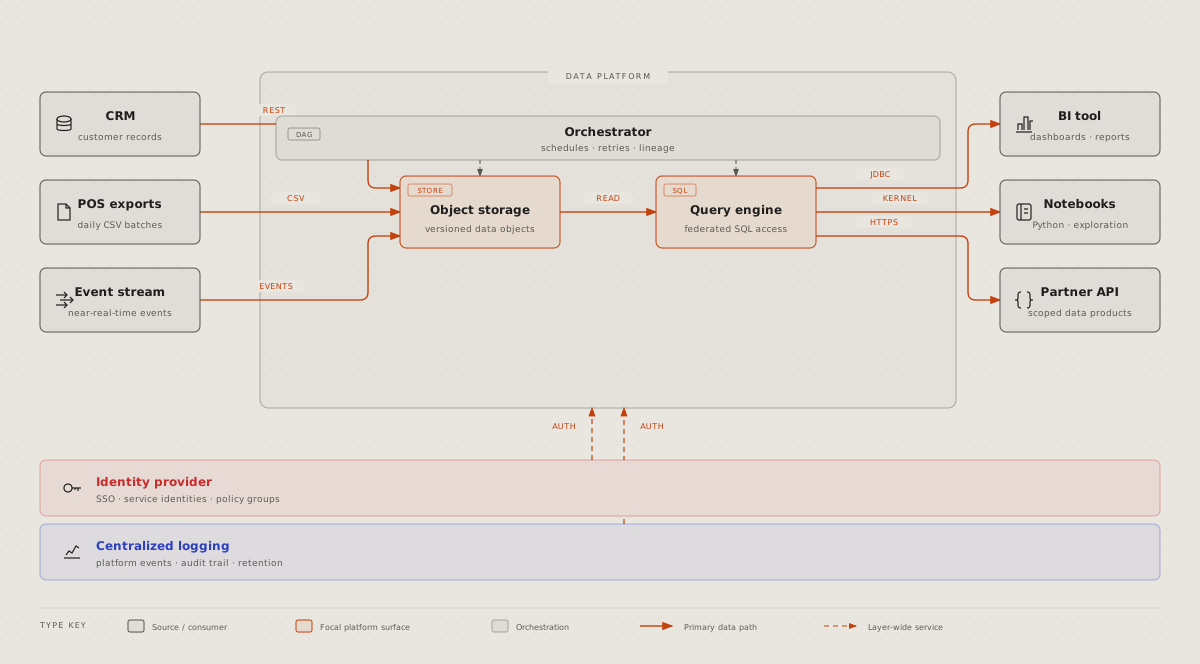
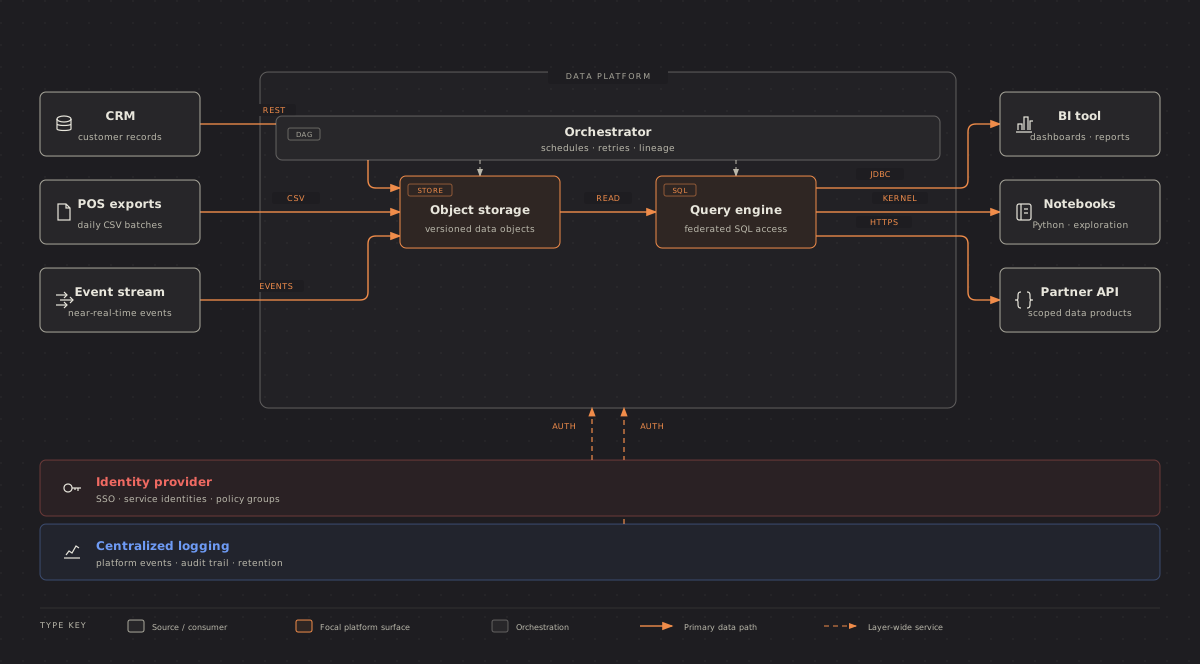
Data platform access: roles as columns, components as rows, in each cell what the role may do. Credit: diagram-design's example-dp-security-matrix.html, © 2025 Cathryn Lavery, MIT licence, recoloured.
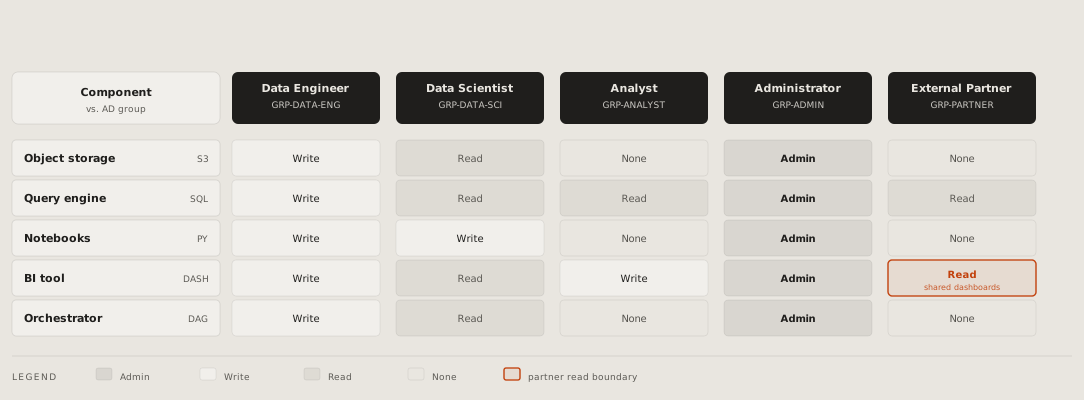
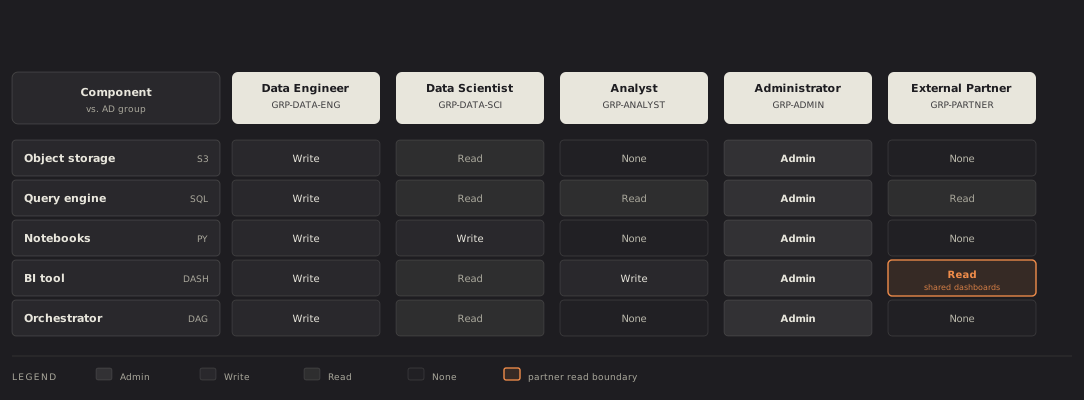
IT current state: today's systems by phase, the manual hand-offs between them labelled, the pains marked; the before of a proposal. Credit: diagram-design's example-it-state.html, © 2025 Cathryn Lavery, MIT licence, recoloured.
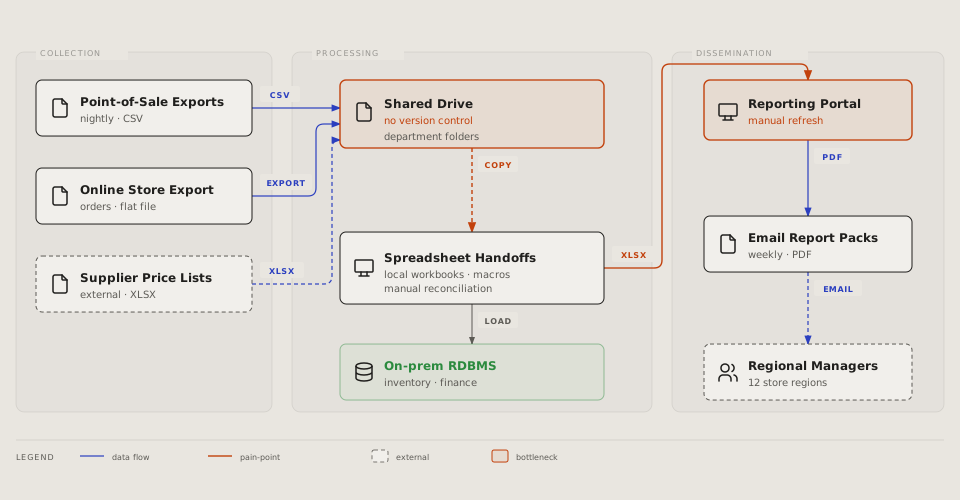
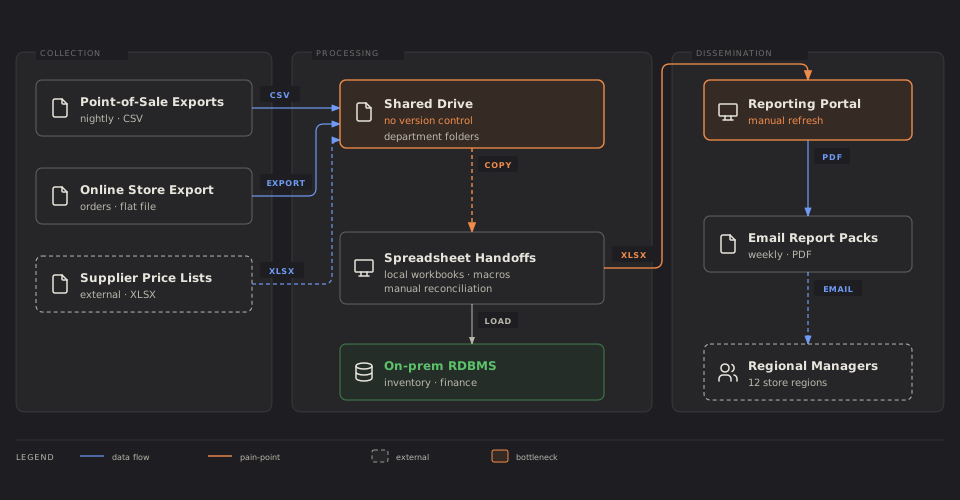
SBGN: a biological process in its standard notation, species as rounded boxes, the processes between them as small squares, the place it happens as a frame. Credit: diagram-design's example-sbgn.html, © 2025 Cathryn Lavery, MIT licence, recoloured.
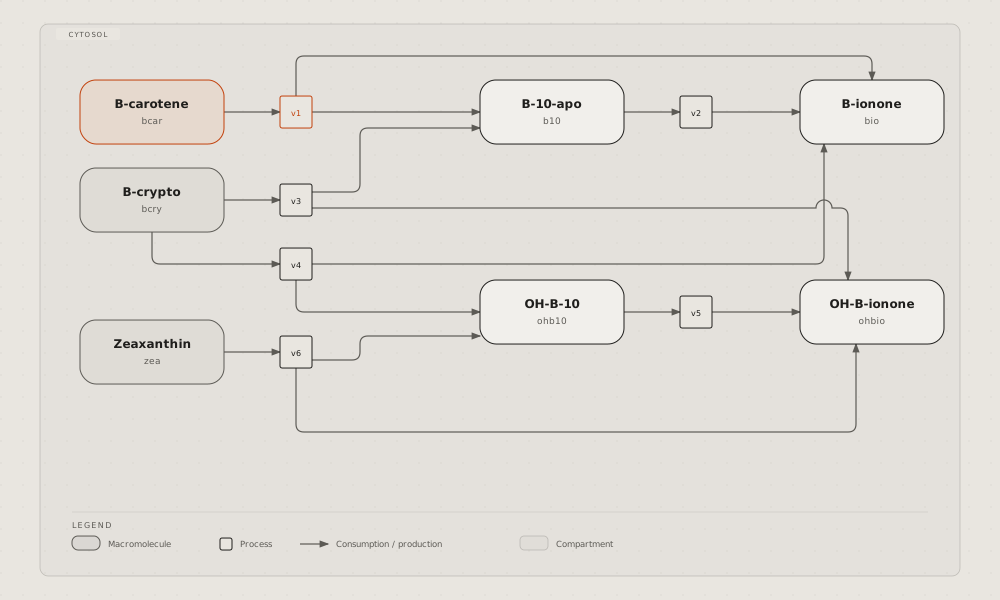
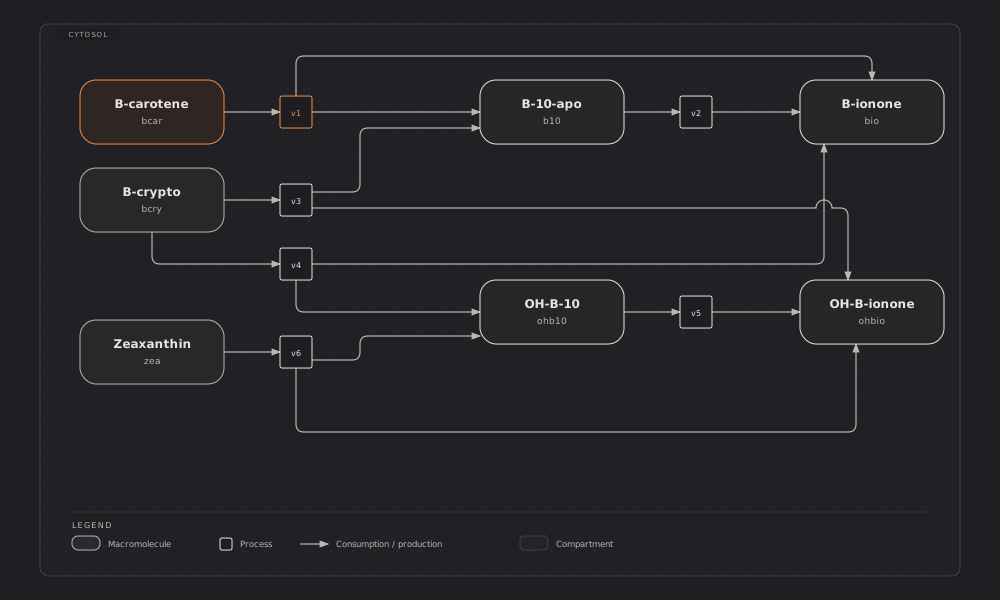
References
- diagram-design by Cathryn Lavery, MIT licence, with its site diagramdesign.dev: an agent skill that draws 50 kinds as hand-written SVG pages and checks them with two scripts. The 25 pictures on this page are its examples, taken at commit f6db0de and recoloured; its licence is kept beside them, in diagrams/diagramdesign/LICENSE.
# Diagram Design: 25 kinds this page has no guide for
[diagram-design](https://github.com/cathrynlavery/diagram-design) is an
agent skill that draws 50 kinds of diagram, each a page with one SVG
written by hand. These are the 25 this page has no guide for, each in
diagram-design's own example, recoloured into this page's colours, light
and dark; the shapes, words and sizes are its own. They are not guides
yet: a kind this page takes in gets a guide of its own.
## How it works
**Process:** a step per box in the lane of the team that does it,
numbered across the top, the data each hands on as a tag; the critical
hand-off in the accent. Credit: diagram-design's
[example-process.html](https://github.com/cathrynlavery/diagram-design/blob/f6db0decea96de66b901331a0f79a8d4b147ebae/skills/diagram-design/assets/example-process.html),
© 2025 Cathryn Lavery, MIT licence, recoloured.
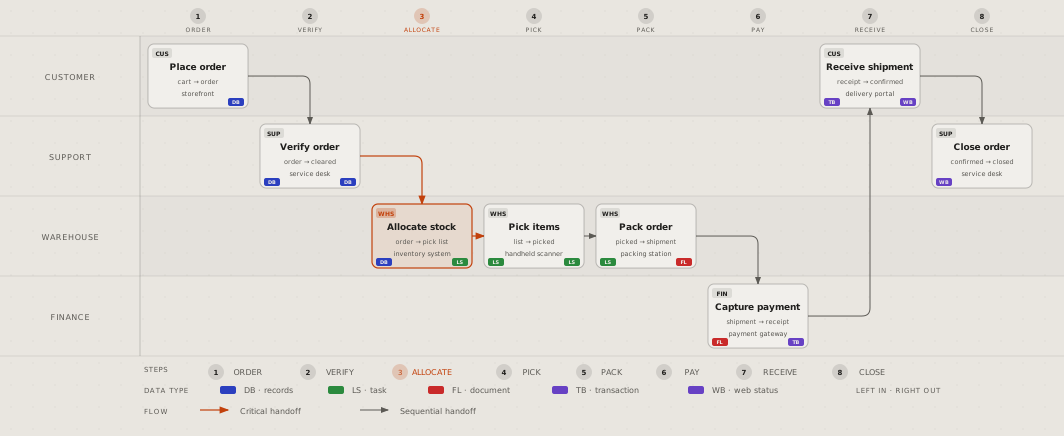
**Service blueprint:** a path in stages, what the customer does and sees
above the line of visibility, what runs backstage below it; the step that
fails in the accent. Credit: diagram-design's
[example-service-blueprint.html](https://github.com/cathrynlavery/diagram-design/blob/f6db0decea96de66b901331a0f79a8d4b147ebae/skills/diagram-design/assets/example-service-blueprint.html),
© 2025 Cathryn Lavery, MIT licence, recoloured.
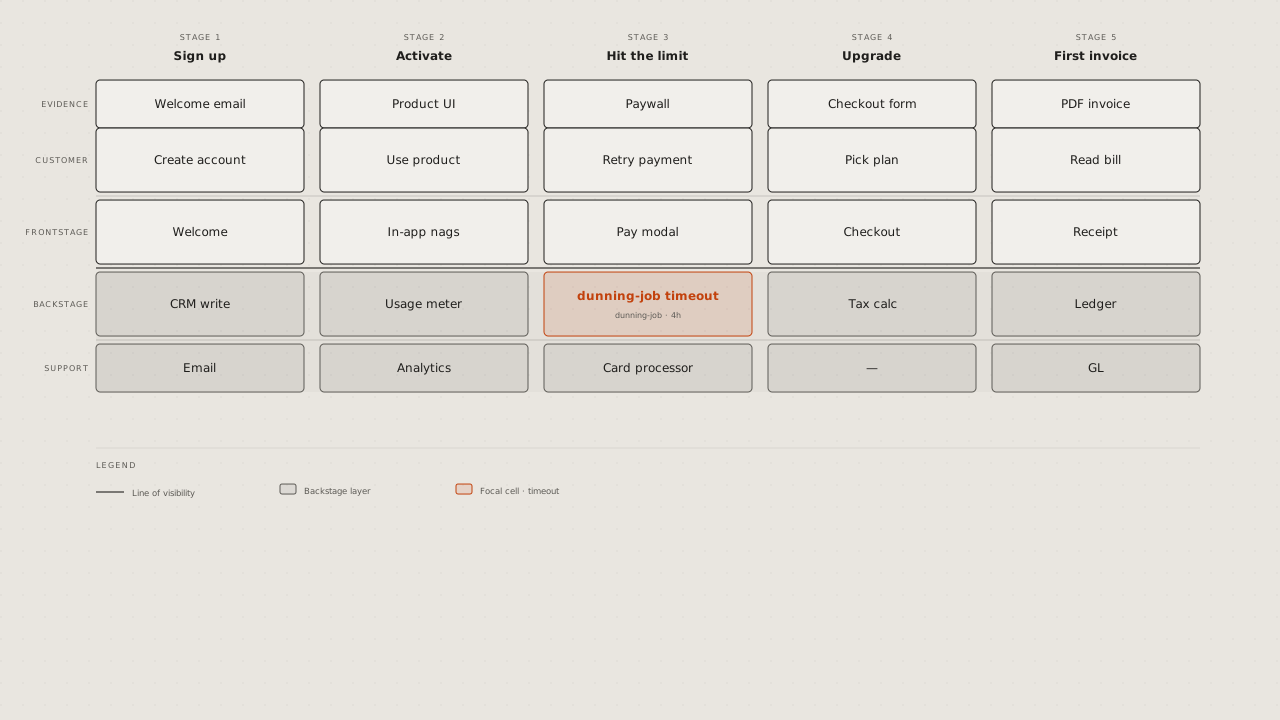
**User journey:** a person's stages across, their actions and touchpoints
under each, a line of how they feel that dips where it hurts. Credit:
diagram-design's
[example-journey.html](https://github.com/cathrynlavery/diagram-design/blob/f6db0decea96de66b901331a0f79a8d4b147ebae/skills/diagram-design/assets/example-journey.html),
© 2025 Cathryn Lavery, MIT licence, recoloured.
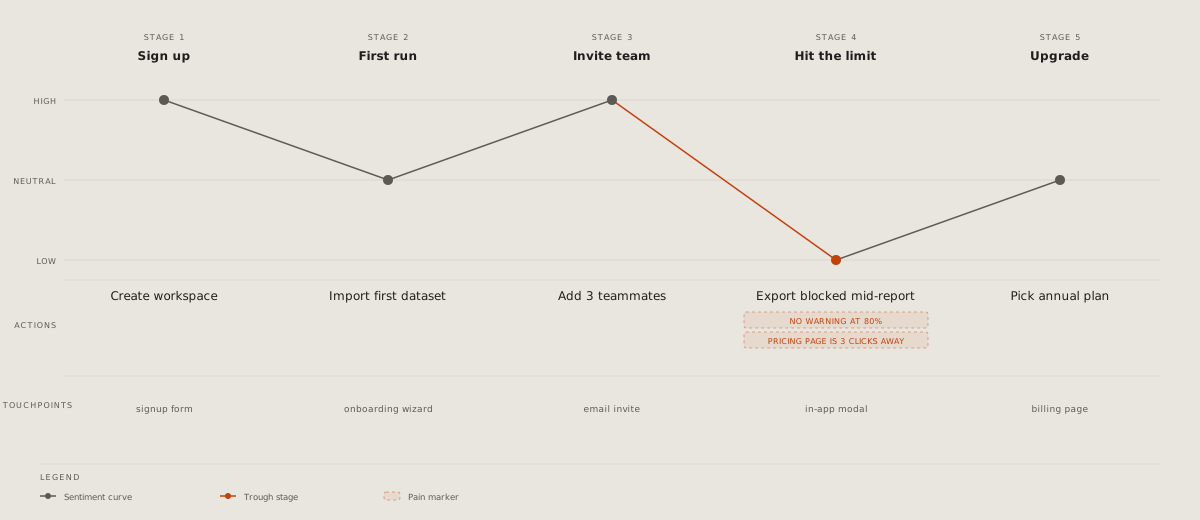
**Event modelling:** time left to right; for each stage the command, the
event it leaves, named in the past tense, and the view read from that
event. Credit: diagram-design's
[example-event-modeling.html](https://github.com/cathrynlavery/diagram-design/blob/f6db0decea96de66b901331a0f79a8d4b147ebae/skills/diagram-design/assets/example-event-modeling.html),
© 2025 Cathryn Lavery, MIT licence, recoloured.
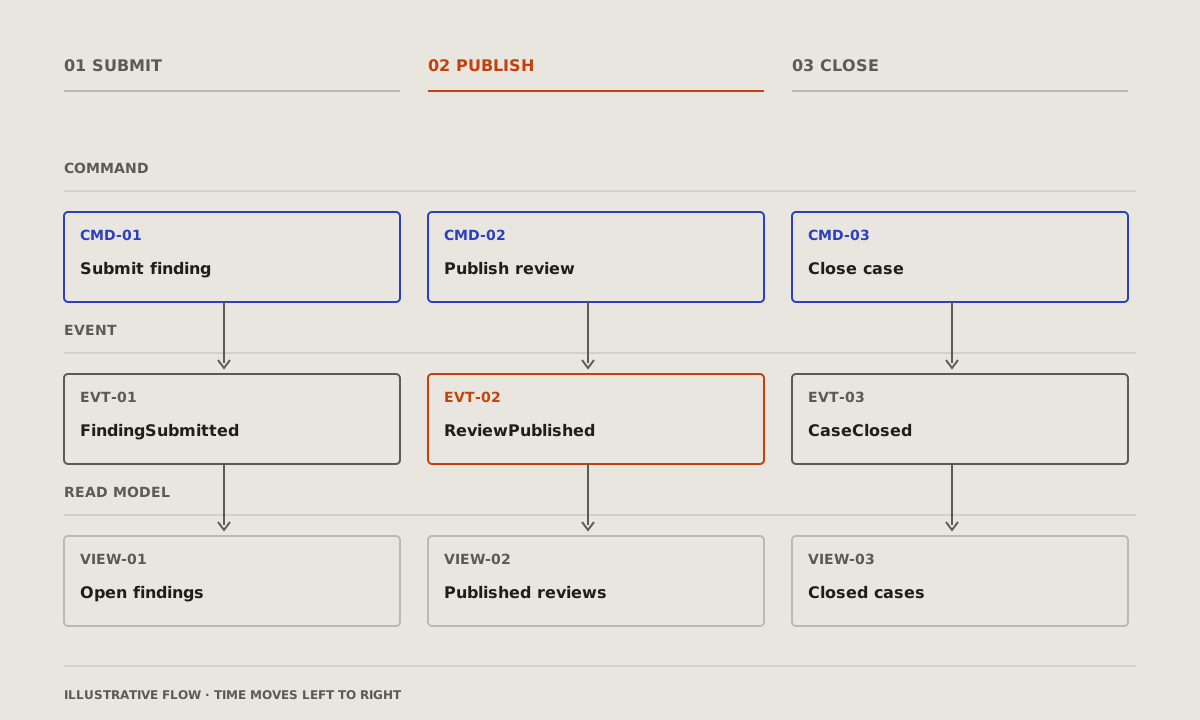
## What it is made of
**Nested:** scopes inside scopes, the widest outside, the one that
matters innermost. Credit: diagram-design's
[example-nested.html](https://github.com/cathrynlavery/diagram-design/blob/f6db0decea96de66b901331a0f79a8d4b147ebae/skills/diagram-design/assets/example-nested.html),
© 2025 Cathryn Lavery, MIT licence, recoloured.
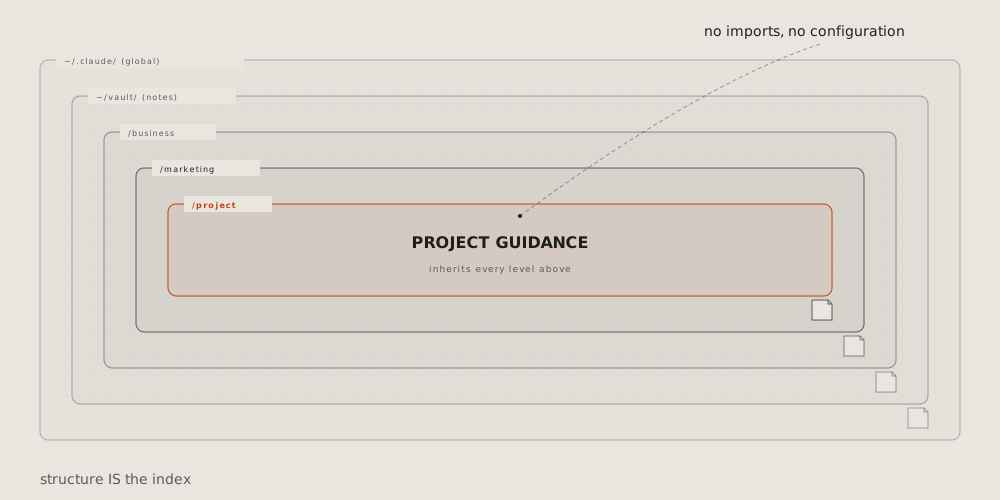
**Layer stack:** levels as bands one on another, the lowest at the
bottom; the layer that matters in the accent. Credit: diagram-design's
[example-layers.html](https://github.com/cathrynlavery/diagram-design/blob/f6db0decea96de66b901331a0f79a8d4b147ebae/skills/diagram-design/assets/example-layers.html),
© 2025 Cathryn Lavery, MIT licence, recoloured.
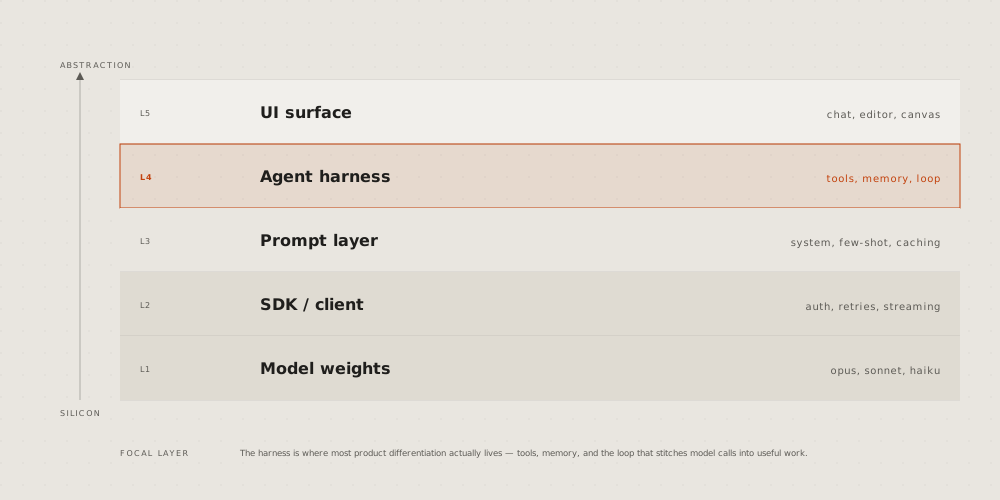
**Org chart:** who reports to whom, a row per level, lines down from each
lead. Credit: diagram-design's
[example-org-chart.html](https://github.com/cathrynlavery/diagram-design/blob/f6db0decea96de66b901331a0f79a8d4b147ebae/skills/diagram-design/assets/example-org-chart.html),
© 2025 Cathryn Lavery, MIT licence, recoloured.
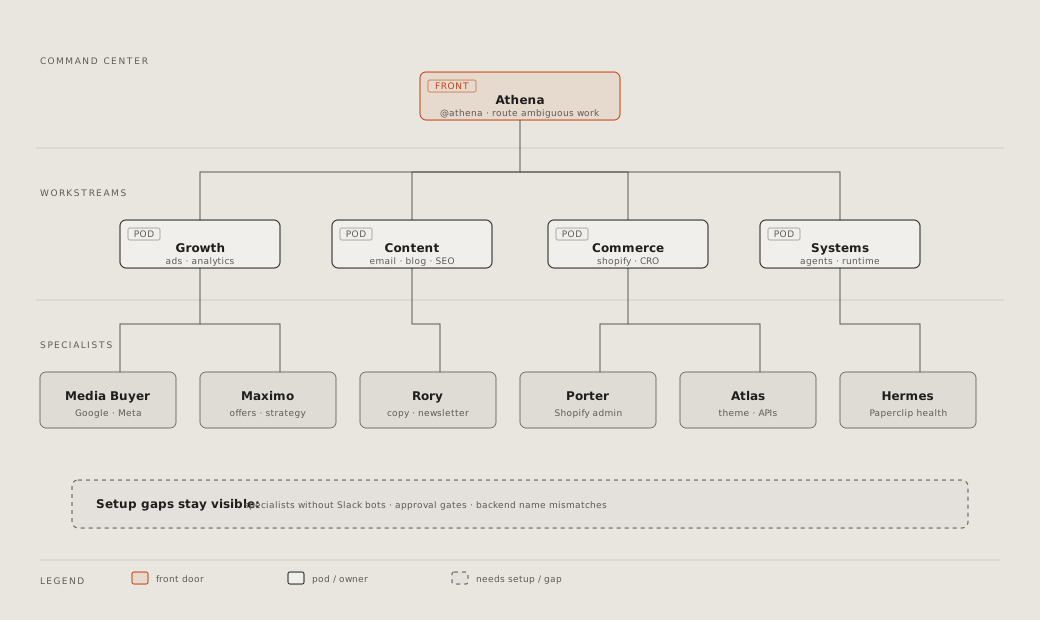
**Database schema:** a box per table, its columns, types and keys; a line
from each foreign key to the key it names, a group per schema. Credit:
diagram-design's
[example-db-schema.html](https://github.com/cathrynlavery/diagram-design/blob/f6db0decea96de66b901331a0f79a8d4b147ebae/skills/diagram-design/assets/example-db-schema.html),
© 2025 Cathryn Lavery, MIT licence, recoloured.
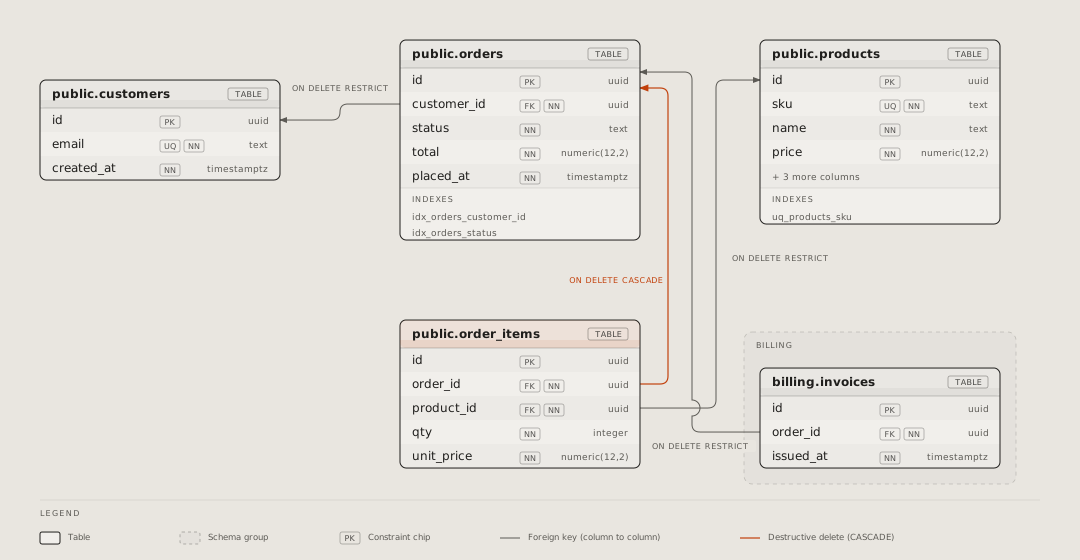
**Exploded view:** one thing's layers pulled apart in depth, each named
at the side. Credit: diagram-design's
[example-exploded.html](https://github.com/cathrynlavery/diagram-design/blob/f6db0decea96de66b901331a0f79a8d4b147ebae/skills/diagram-design/assets/example-exploded.html),
© 2025 Cathryn Lavery, MIT licence, recoloured.
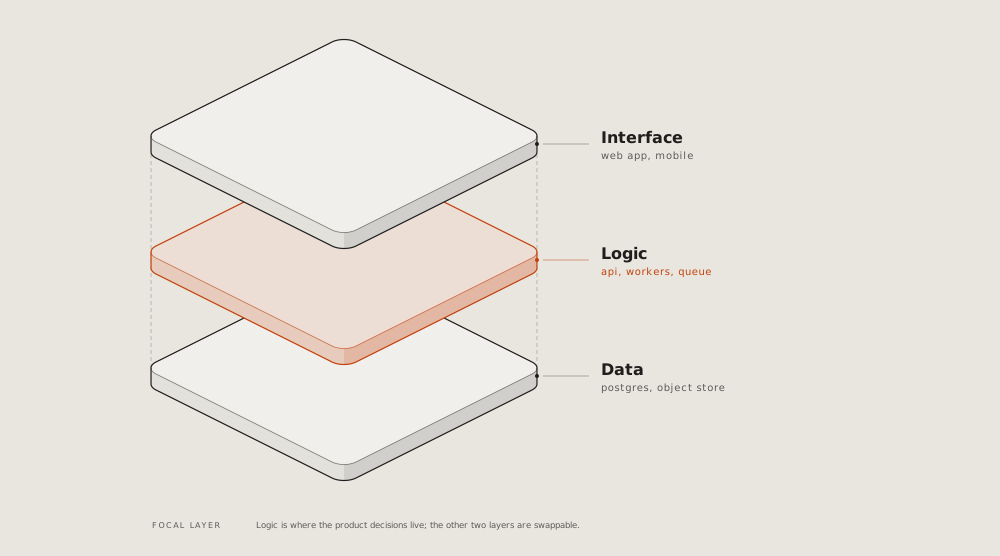
**Axonometric plan:** a floor or a site from above, at an angle, its
rooms named; the one under discussion in the accent. Credit:
diagram-design's
[example-axonometric-plan.html](https://github.com/cathrynlavery/diagram-design/blob/f6db0decea96de66b901331a0f79a8d4b147ebae/skills/diagram-design/assets/example-axonometric-plan.html),
© 2025 Cathryn Lavery, MIT licence, recoloured.
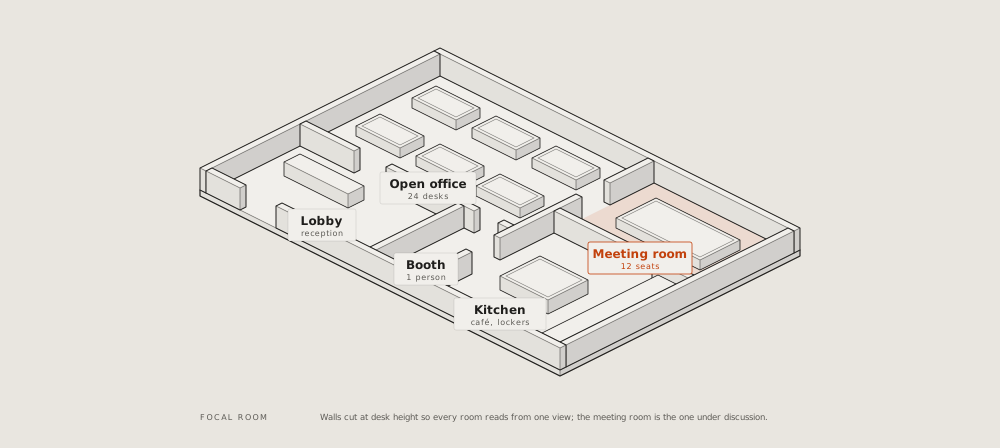
## Where it stands
**Story map:** the user's activities across as a backbone, the stories
under each, cut into releases by lines; the riskiest story marked.
Credit: diagram-design's
[example-story-map.html](https://github.com/cathrynlavery/diagram-design/blob/f6db0decea96de66b901331a0f79a8d4b147ebae/skills/diagram-design/assets/example-story-map.html),
© 2025 Cathryn Lavery, MIT licence, recoloured.
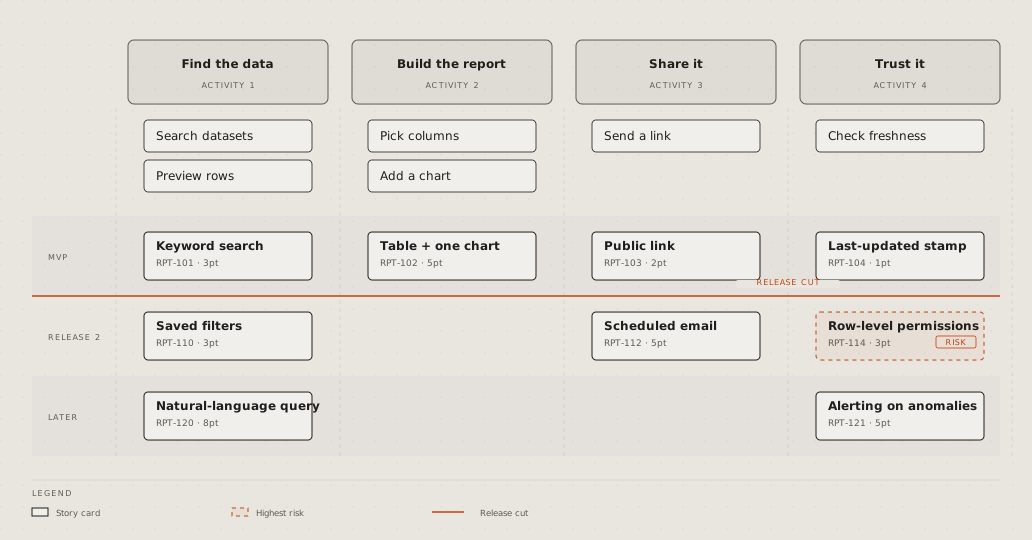
**Traceability:** each need traced by its id to the design that meets it
and the test that checks it; a need with no test in the accent. Credit:
diagram-design's
[example-requirement-traceability.html](https://github.com/cathrynlavery/diagram-design/blob/f6db0decea96de66b901331a0f79a8d4b147ebae/skills/diagram-design/assets/example-requirement-traceability.html),
© 2025 Cathryn Lavery, MIT licence, recoloured.
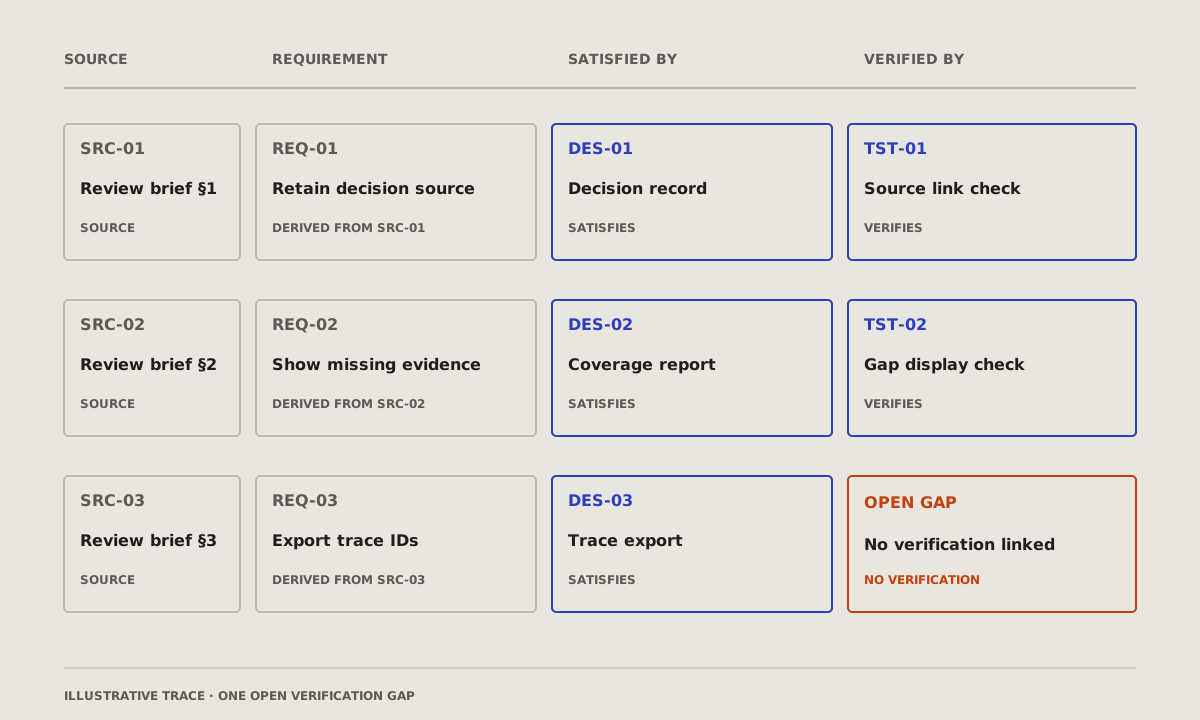
## What it changes
**Wardley map:** the parts of a product from what the user sees down to
what nobody sees, placed by how mature each is, from new to commodity; an
arrow where one is moving. Credit: diagram-design's
[example-wardley.html](https://github.com/cathrynlavery/diagram-design/blob/f6db0decea96de66b901331a0f79a8d4b147ebae/skills/diagram-design/assets/example-wardley.html),
© 2025 Cathryn Lavery, MIT licence, recoloured.
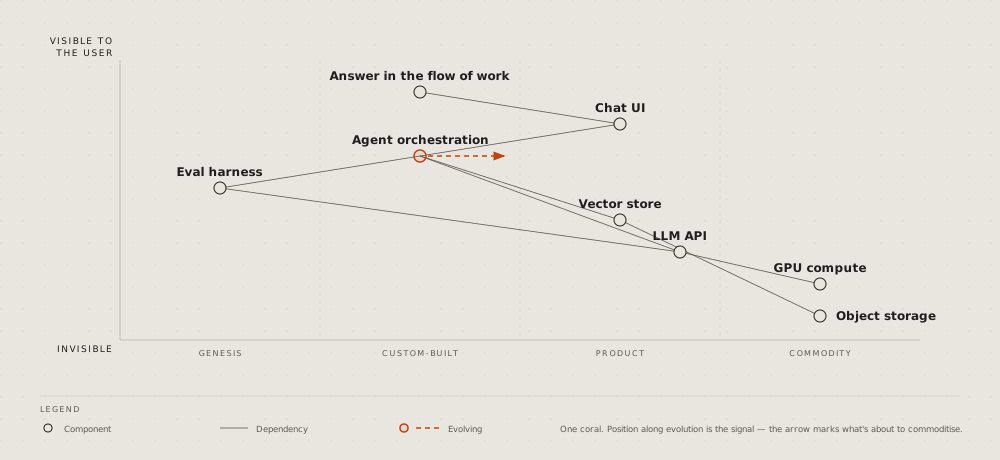
## How much
**Scatter plot:** two numbers per item, a dot each, the trend as a line;
the one that matters named. Credit: diagram-design's
[example-scatter.html](https://github.com/cathrynlavery/diagram-design/blob/f6db0decea96de66b901331a0f79a8d4b147ebae/skills/diagram-design/assets/example-scatter.html),
© 2025 Cathryn Lavery, MIT licence, recoloured.
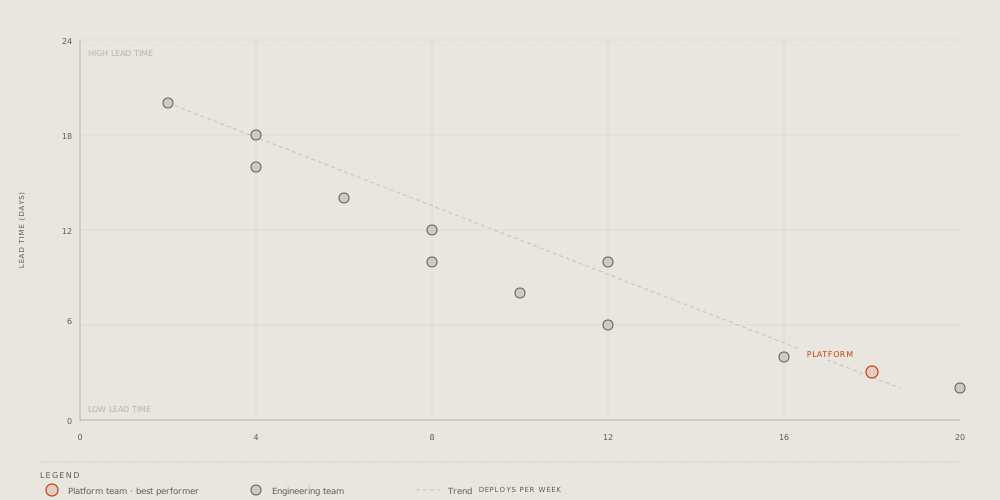
**Radar:** a few options scored on three to six criteria, a shape per
option on the spokes. Credit: diagram-design's
[example-radar.html](https://github.com/cathrynlavery/diagram-design/blob/f6db0decea96de66b901331a0f79a8d4b147ebae/skills/diagram-design/assets/example-radar.html),
© 2025 Cathryn Lavery, MIT licence, recoloured.
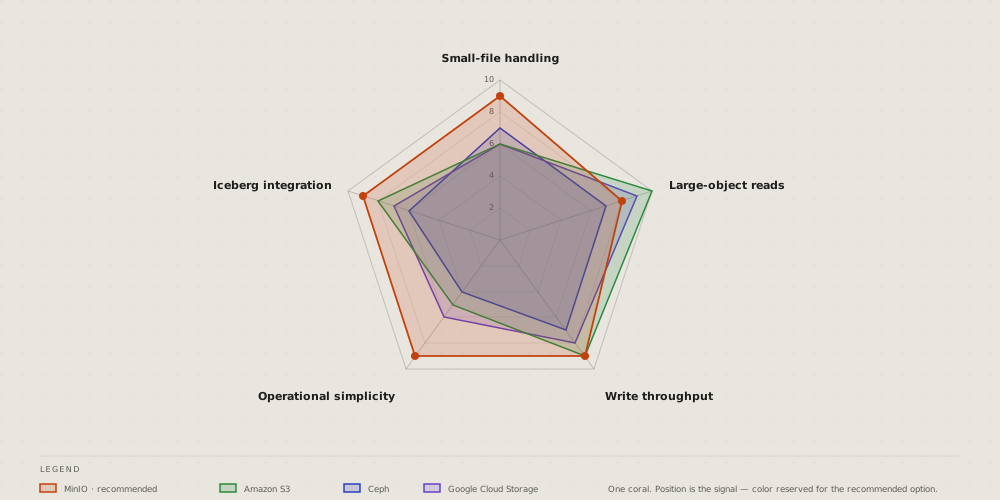
**Polar chart:** one number around a cycle, the hours of a day as
spokes; the peak in the accent. Credit: diagram-design's
[example-polar.html](https://github.com/cathrynlavery/diagram-design/blob/f6db0decea96de66b901331a0f79a8d4b147ebae/skills/diagram-design/assets/example-polar.html),
© 2025 Cathryn Lavery, MIT licence, recoloured.
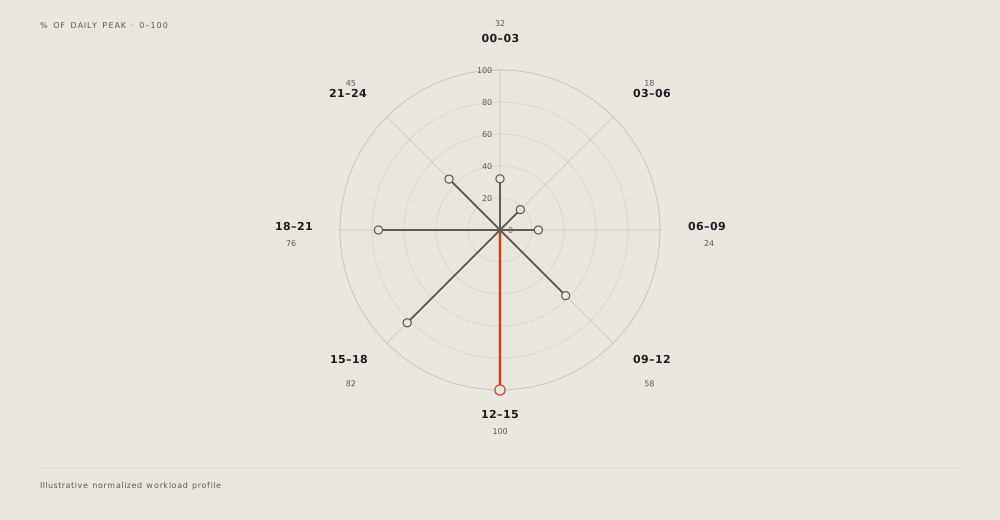
**Pyramid:** levels from a wide base to a narrow top, the rare and
valuable at the apex; turned over, a funnel. Credit: diagram-design's
[example-pyramid.html](https://github.com/cathrynlavery/diagram-design/blob/f6db0decea96de66b901331a0f79a8d4b147ebae/skills/diagram-design/assets/example-pyramid.html),
© 2025 Cathryn Lavery, MIT licence, recoloured.
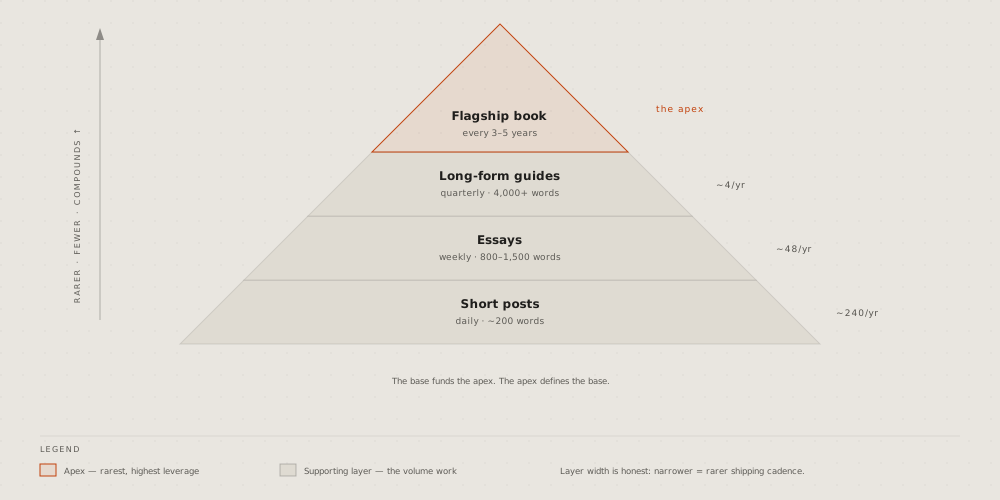
**Venn:** what two or three sets share; the overlap that matters named.
Credit: diagram-design's
[example-venn.html](https://github.com/cathrynlavery/diagram-design/blob/f6db0decea96de66b901331a0f79a8d4b147ebae/skills/diagram-design/assets/example-venn.html),
© 2025 Cathryn Lavery, MIT licence, recoloured.
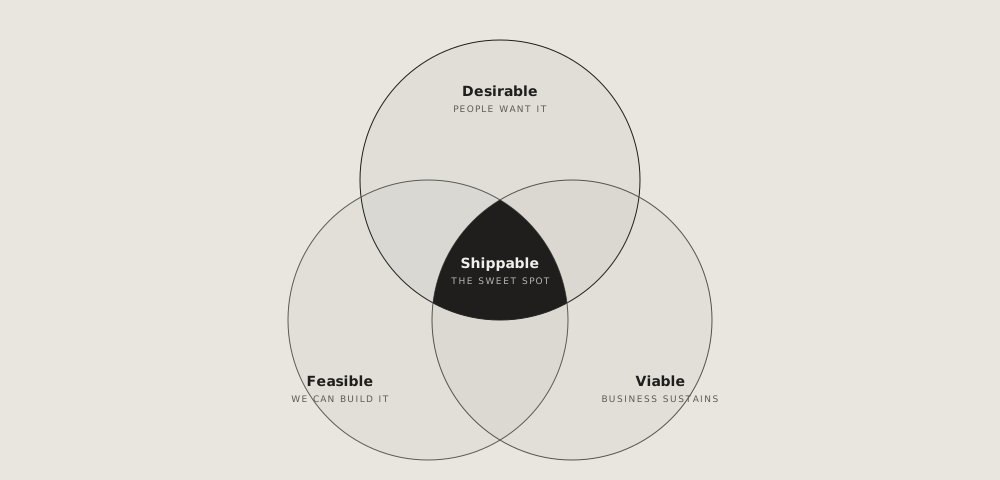
**Waterfall, a running total:** where it starts, each step up or down as
a floating bar, where it ends; not the [waterfall](https://github.com/vbarbarosh/rules/blob/main/diagrams/waterfall.md) of one
request's time. Credit: diagram-design's
[example-waterfall.html](https://github.com/cathrynlavery/diagram-design/blob/f6db0decea96de66b901331a0f79a8d4b147ebae/skills/diagram-design/assets/example-waterfall.html),
© 2025 Cathryn Lavery, MIT licence, recoloured.
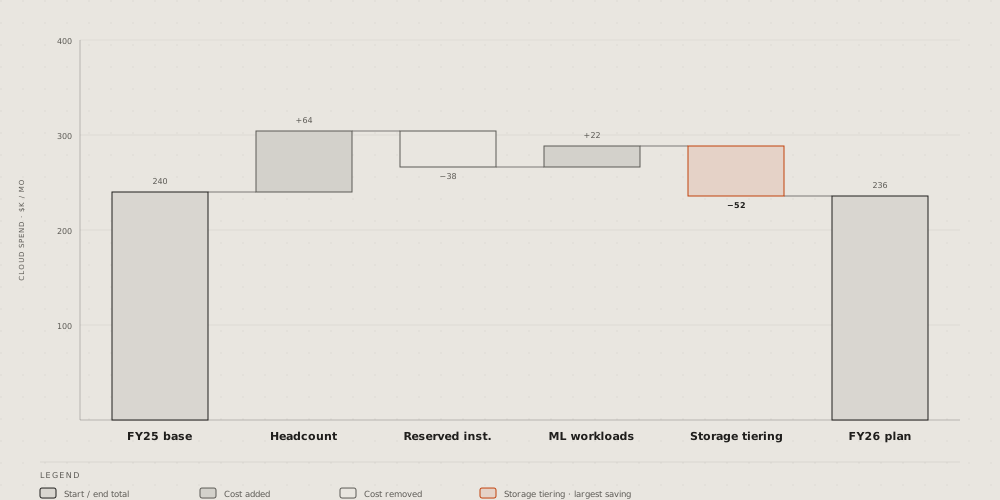
## For one trade
**High-level data stack:** a data platform end to end, from the sources
through ingestion, storage and query to the dashboards, on its cluster.
Credit: diagram-design's
[example-high-level.html](https://github.com/cathrynlavery/diagram-design/blob/f6db0decea96de66b901331a0f79a8d4b147ebae/skills/diagram-design/assets/example-high-level.html),
© 2025 Cathryn Lavery, MIT licence, recoloured.
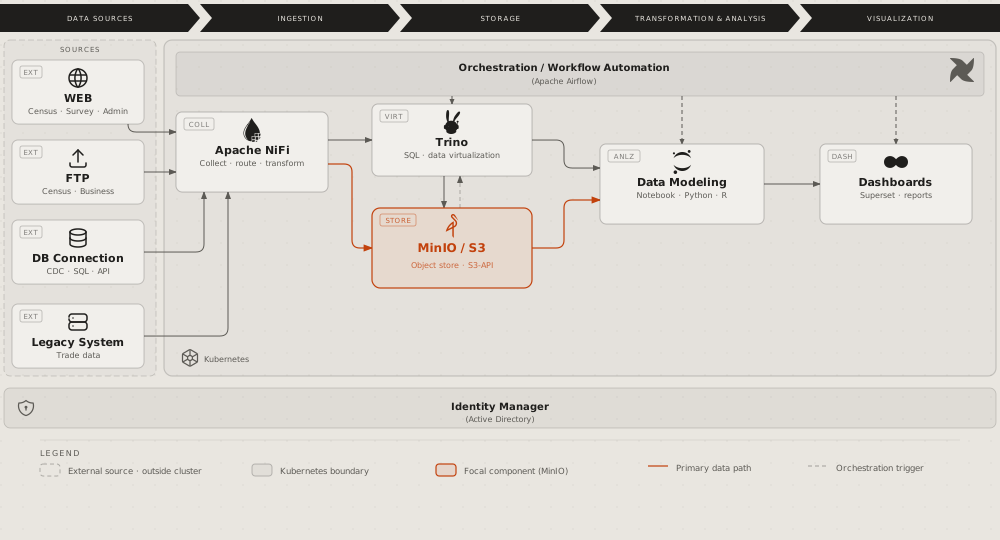
**Medallion:** data kept in tiers by quality, from raw to aggregated,
each tier's tool, format and writer. Credit: diagram-design's
[example-medallion.html](https://github.com/cathrynlavery/diagram-design/blob/f6db0decea96de66b901331a0f79a8d4b147ebae/skills/diagram-design/assets/example-medallion.html),
© 2025 Cathryn Lavery, MIT licence, recoloured.

**Data platform integration:** the systems that feed a platform, the
consumers it serves, and the protocol on each link. Credit:
diagram-design's
[example-dp-integration.html](https://github.com/cathrynlavery/diagram-design/blob/f6db0decea96de66b901331a0f79a8d4b147ebae/skills/diagram-design/assets/example-dp-integration.html),
© 2025 Cathryn Lavery, MIT licence, recoloured.
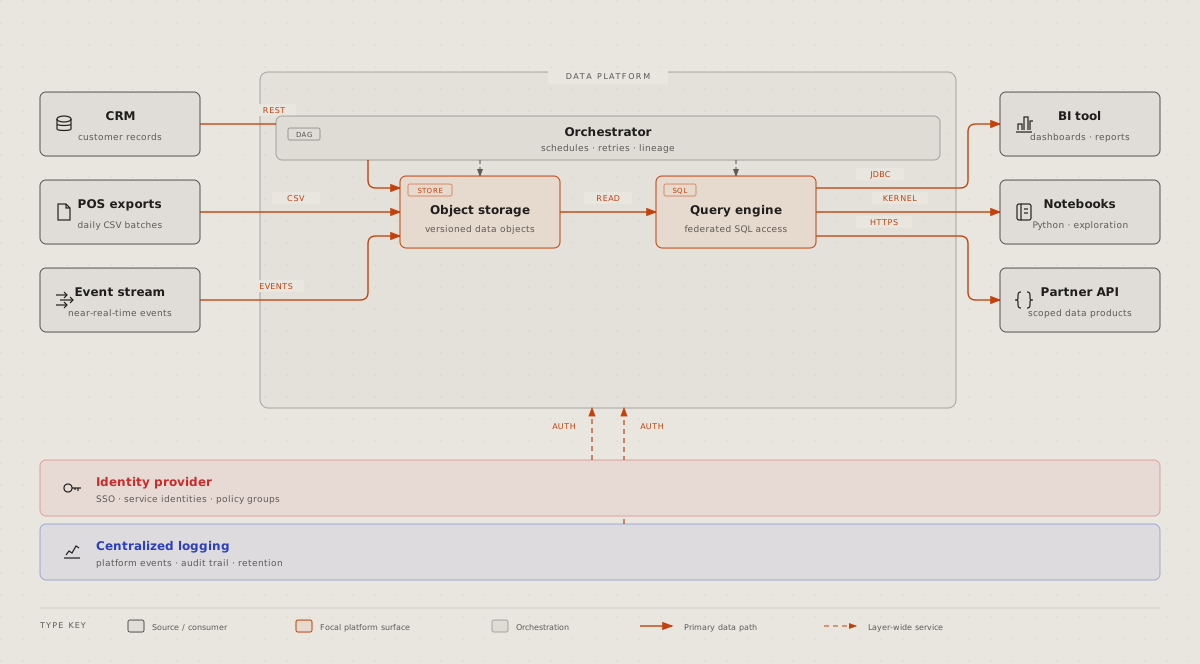
**Data platform access:** roles as columns, components as rows, in each
cell what the role may do. Credit: diagram-design's
[example-dp-security-matrix.html](https://github.com/cathrynlavery/diagram-design/blob/f6db0decea96de66b901331a0f79a8d4b147ebae/skills/diagram-design/assets/example-dp-security-matrix.html),
© 2025 Cathryn Lavery, MIT licence, recoloured.
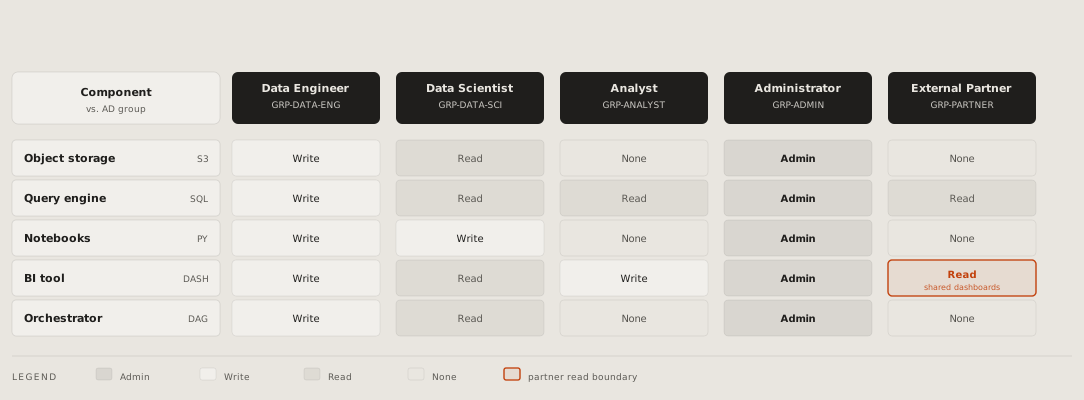
**IT current state:** today's systems by phase, the manual hand-offs
between them labelled, the pains marked; the before of a proposal.
Credit: diagram-design's
[example-it-state.html](https://github.com/cathrynlavery/diagram-design/blob/f6db0decea96de66b901331a0f79a8d4b147ebae/skills/diagram-design/assets/example-it-state.html),
© 2025 Cathryn Lavery, MIT licence, recoloured.
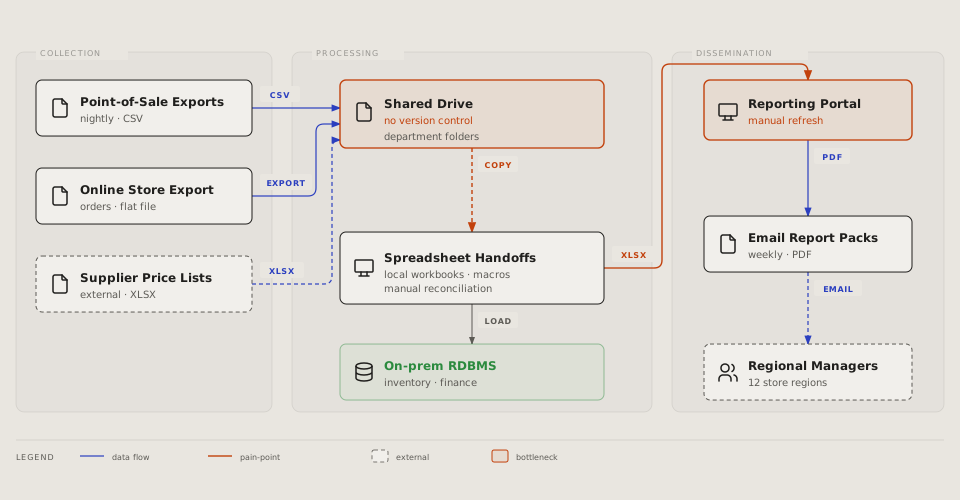
**SBGN:** a biological process in its standard notation, species as
rounded boxes, the processes between them as small squares, the place it
happens as a frame. Credit: diagram-design's
[example-sbgn.html](https://github.com/cathrynlavery/diagram-design/blob/f6db0decea96de66b901331a0f79a8d4b147ebae/skills/diagram-design/assets/example-sbgn.html),
© 2025 Cathryn Lavery, MIT licence, recoloured.
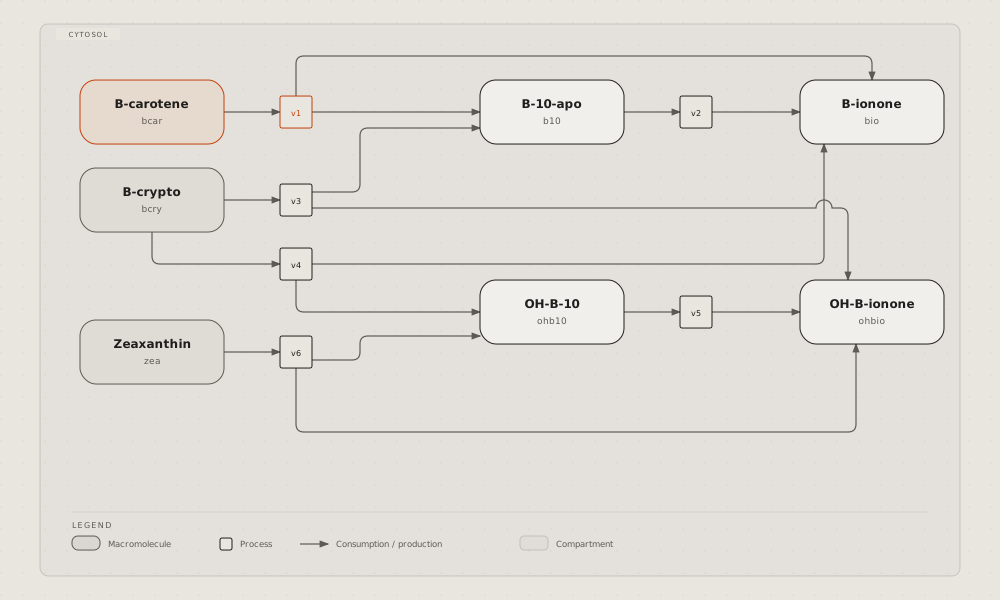
## References
- [diagram-design](https://github.com/cathrynlavery/diagram-design) by
Cathryn Lavery, MIT licence, with its site
[diagramdesign.dev](https://diagramdesign.dev): an agent skill that
draws 50 kinds as hand-written SVG pages and checks them with two
scripts. The 25 pictures on this page are its examples, taken at
commit f6db0de and recoloured; its licence is kept beside them, in
[diagrams/diagramdesign/LICENSE](https://github.com/vbarbarosh/rules/blob/main/diagrams/diagramdesign/LICENSE).
No diagram matches that.